ROI Calculator
Measure return on investment, net profit, annualized ROI, CAGR, and total return multiple. Add cash flows, extra contributions, and holding time to compare deals on an equal, per-year basis.
🎯Real Investment Presets
📝Investment Inputs
Used when method is final value.
Used when method is net profit direct.
🔢Formula Snapshot
📊Simple vs Annualized (Your Numbers)
| Measure | Value | Meaning | Best For |
|---|---|---|---|
| Enter values above to compare simple and annualized returns. | |||
| Horizon | Growth Factor | Value of Cost | Cumulative ROI |
|---|---|---|---|
| A per-year projection appears after calculation. | |||
📉ROI to Annualized Reference
| Total ROI | Over 1 yr | Over 3 yr | Over 5 yr | Over 10 yr |
|---|---|---|---|---|
| 10% | 10.0% | 3.2% | 1.9% | 1.0% |
| 25% | 25.0% | 7.7% | 4.6% | 2.3% |
| 50% | 50.0% | 14.5% | 8.4% | 4.1% |
| 100% | 100.0% | 26.0% | 14.9% | 7.2% |
| 200% | 200.0% | 44.2% | 24.6% | 11.6% |
| 400% | 400.0% | 71.0% | 38.0% | 17.5% |
⏳Time to Double (Rule of 72)
| Annual Rate | Rule of 72 | Exact Doubling | Multiple in 10 yr |
|---|---|---|---|
| 3% | 24.0 yr | 23.4 yr | 1.34× |
| 5% | 14.4 yr | 14.2 yr | 1.63× |
| 7% | 10.3 yr | 10.2 yr | 1.97× |
| 10% | 7.2 yr | 7.3 yr | 2.59× |
| 15% | 4.8 yr | 5.0 yr | 4.05× |
| 20% | 3.6 yr | 3.8 yr | 6.19× |
🗂Investment Type Comparison Grid
| Investment Type | Typical Hold | Typical Annual | Cash Flow? | Liquidity | Risk |
|---|---|---|---|---|---|
| Index fund (broad) | 10–30 yr | 7% to 10% | Dividends | High | Medium |
| Individual stock | 1–5 yr | Varies widely | Sometimes | High | High |
| Rental property | 5–20 yr | 8% to 12% | Monthly rent | Low | Medium |
| House flip | 3–9 mo | High if fast | None | Low | High |
| Bond / bond ladder | 1–10 yr | 3% to 6% | Coupons | Medium | Low |
| Marketing campaign | Weeks | ROAS based | Revenue | N/A | Medium |
| Crypto trade | Days–months | Very volatile | Rare | High | Very high |
| Small business | 3–10 yr | Wide range | Profit draws | Very low | High |
⚙Full Formula Breakdown
📋Reference Values
| Input | Common Range | How It Is Used | Effect on ROI |
|---|---|---|---|
| Initial cost | Any positive amount | Base of total invested | Higher cost lowers ROI % |
| Cash flows | Dividends, rent, coupons | Added to gain if reinvested | Raises total return |
| Holding period | Days to decades | Converted to years for annualizing | Longer time lowers annual rate |
| Fees / taxes | 0% to 30% of gain | Subtracted from net profit | Reduces ROI and multiple |
| Contributions | Any added capital | Increases total invested | Dilutes ROI percentage |
💡Practical ROI Tips
It’s possible to make a big paper gain. But lose money in reality. How? Because raw return figures can be deceiving unless you understand how to read them. Twenty percent gains sound awesome, until you learn it require five years of idle cash. Or maybe you discover you lost half the gain to fees before seeing any cash at all.
The calculator above do the math when you feed it your time frames and costs. It spares you from trying to compare apples-to-oranges investments directly. But that’s only half the story. That’s where the hard part comes: learning what these results mean in terms of your wallet.
How to Understand Your Investment Results
Investors are most prone to a trap: conflating total return with annualized performance. Say I purchase a stock at ten thousand bucks, which balloons to fifteen thousand in three years. That’s a gain of fifty percent. Not bad! But what if, after ten years, I finally sell that same holding and get a similar multiple? My yearly efficiency fall like a rock. While I covered more ground over ten years, I was hardly moving quickly during those years.
The calculator on this page will turn your total percentage into an annualized one (CAGR), stripping out the time component so you can fairly evaluate a long-term index fund alongside a short-term flip. Time is the stealth variable of all financial decisions. The reference tables that comes with the calculator make it plain, showing how a hundred-percent total return over a decade averages out to about seven percent per year. That’s why context counts. Our brains like big numbers more than stable ones. A hundred percent spike can lull us into chasing that. However, five percent compound interest is actualy better math-wise over two decades.
Discipline is forced by the yearly perspective. It will tell you: Is this really an efficient opportunity? Or is it only appearing so due to having a long enough holding period to appear respectable?
There are other hidden costs, such as fees and taxes, that most of us forget about until it’s too late. If you’re calculating your return based off the gross revenues, without accounting for any transaction costs, management fees, or capital gains taxes at exit, you’re ignoring things that change the nature of the deal entirely. Those will change the entire nature of the deal. Add those as deductions into your fields in the calculator. Three percent fee structure? Ten percent gross? Now you’re fighting over pennies. Always subtract the exit cost before breaking out the champagne. It’s just one little step, but it saves you from expensive delusions of wealth.
Next is cash flow, such as rental income or dividends. These payments can be spent immediately, or they can be reinvested to increase compound growth. If the underlying asset perform the same, then the two strategies will generate different total returns. Taking cash out levels out the curve. Reinvesting boosts compounding and accelerates the curve. Because neither strategy is right or wrong, you should of toggle this option on the tool so that you’re using a metric that matches what you do with your own money.
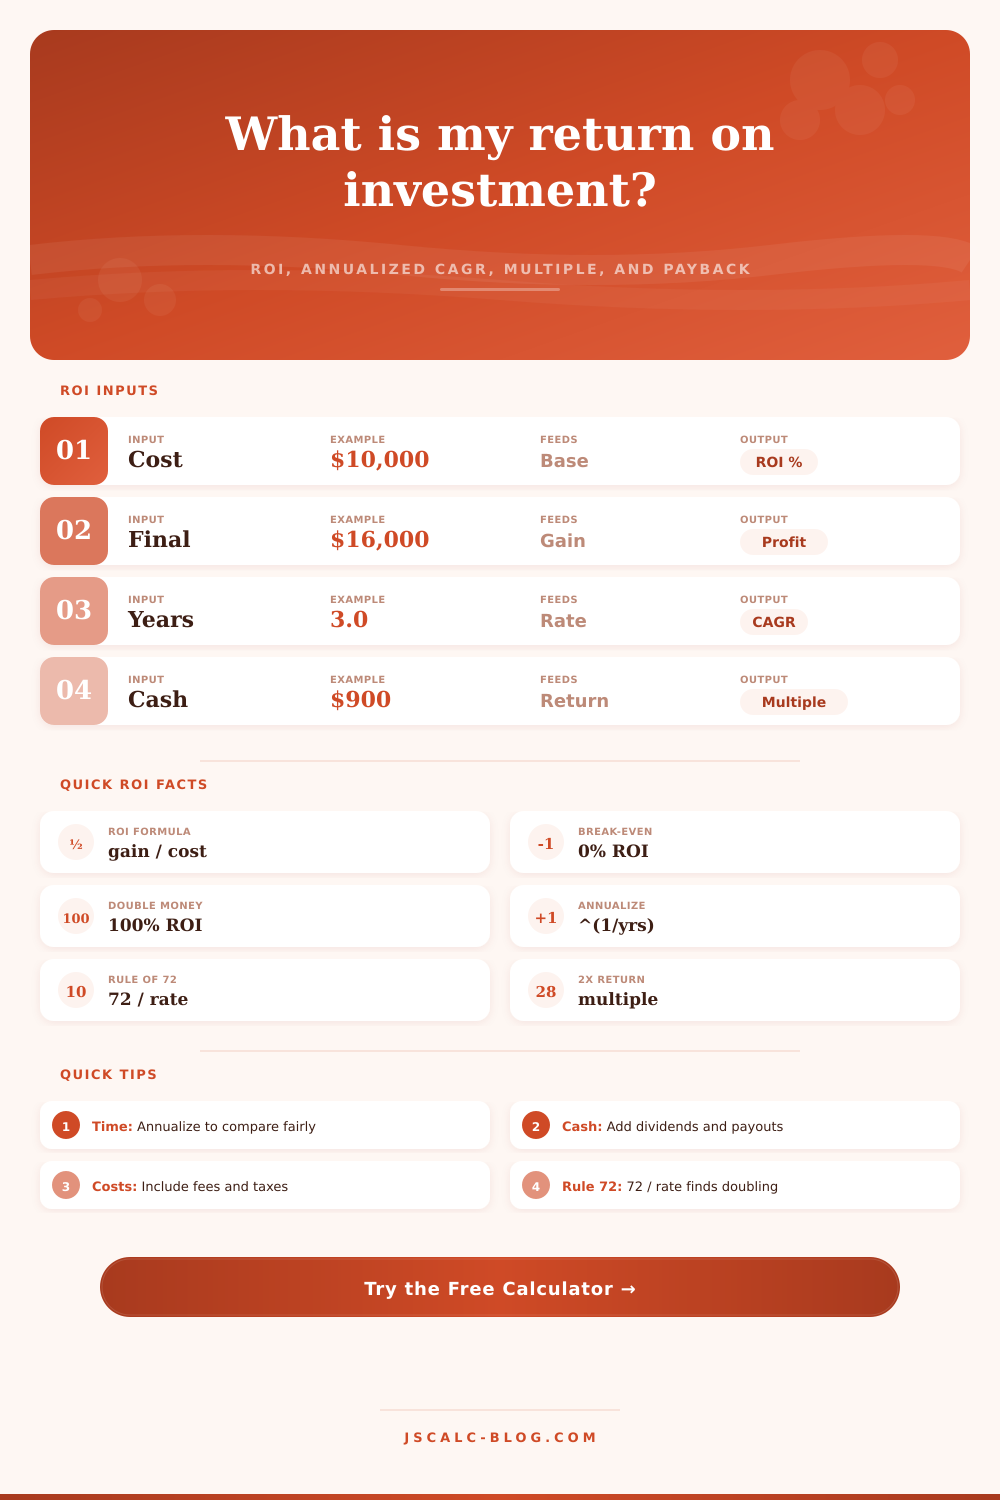
In the breakdown we reference The Rule of 72, which is a handy mental shortcut for calculating how long it would take to double your money if you had a yearly rate. Take the number 72 and divide by your rate; that’s the number of years it’d take to double your money. For example, with a rate of ten percent, it’s going to be seven point two years. It’s a handy sanity check on your more elaborate models. Did your spreadsheet tell you that you’ll double in three years at five percent? Something is wrong here, and you want to catch these mistakes before they cost you dearly.
In the end, ROI is merely a metric. It doesn’t indicate liquidity, safety, appropriateness based off your life stage, etc. Having a high ROI on an illiquid stake in a private company isn’t useful if you have to withdraw cash within the next month to pay rent. The calculator provides the precision; you provide the context.
Subtract out the actual expenses. Look at the annualized rate. Is it worth your time? Does it fit your goals?
The noise clears once you stop chasing large percentage returns and begin optimizing for sustainable, efficient growth. That’s when the math begins to work for you rather than against you.