Exponential Depreciation Calculator
Model asset value with the declining-balance (exponential decay) method. Enter the initial cost, annual depreciation rate, useful life, and optional salvage value to get the current book value V(t) = V0 times (1 - r) to the power t, the year-by-year schedule, accumulated depreciation, and a side-by-side straight-line comparison with the crossover year.
🎯Real Asset Depreciation Presets
📝Asset and Depreciation Inputs
Purchase price or original cost basis of the asset.
DDB and 150% derive the rate from useful life below.
Percent of remaining book value lost each year (custom method).
Depreciation period and basis for DDB and 150% rates.
Age of the asset now; sets the current book value V(t).
Floor value; the asset never depreciates below this amount.
Prefix shown on every money result.
Rounding applied to money cards and the schedule.
🔢Formula Snapshot
📋Year-by-Year Depreciation Schedule
| Year | Opening Value | Depreciation | Accumulated | Closing Value |
|---|
📊Typical Depreciation Rates by Asset Class
| Asset Class | Common Rate | Useful Life | Method Style |
|---|---|---|---|
| Passenger vehicles | 15 - 25% | 5 - 8 yr | Declining balance |
| Laptops and phones | 30 - 50% | 3 - 5 yr | Double declining |
| Servers and IT | 25 - 30% | 4 - 5 yr | Declining balance |
| Heavy machinery | 18 - 25% | 8 - 12 yr | Declining balance |
| Office furniture | 10 - 12% | 10 - 15 yr | Declining balance |
| Farm equipment | 15 - 20% | 8 - 12 yr | 150% declining |
| Appliances | 15 - 20% | 7 - 10 yr | Declining balance |
📏Double-Declining Rate by Useful Life
| Useful Life | DDB Rate (2 / n) | 150% Rate (1.5 / n) | Straight-Line (1 / n) |
|---|---|---|---|
| 3 years | 66.7% | 50.0% | 33.3% |
| 4 years | 50.0% | 37.5% | 25.0% |
| 5 years | 40.0% | 30.0% | 20.0% |
| 7 years | 28.6% | 21.4% | 14.3% |
| 8 years | 25.0% | 18.8% | 12.5% |
| 10 years | 20.0% | 15.0% | 10.0% |
| 15 years | 13.3% | 10.0% | 6.7% |
🗃Book Value by Year and Rate (per $10,000 cost)
| Year | r = 10% | r = 15% | r = 20% | r = 25% | r = 40% |
|---|---|---|---|---|---|
| 0 | $10,000 | $10,000 | $10,000 | $10,000 | $10,000 |
| 1 | $9,000 | $8,500 | $8,000 | $7,500 | $6,000 |
| 2 | $8,100 | $7,225 | $6,400 | $5,625 | $3,600 |
| 3 | $7,290 | $6,141 | $5,120 | $4,219 | $2,160 |
| 4 | $6,561 | $5,220 | $4,096 | $3,164 | $1,296 |
| 5 | $5,905 | $4,437 | $3,277 | $2,373 | $778 |
| 7 | $4,783 | $3,206 | $2,097 | $1,335 | $280 |
| 10 | $3,487 | $1,969 | $1,074 | $563 | $60 |
📈Declining Balance vs Straight-Line ($10,000, 5-year life)
| Year | DDB Depreciation | Straight-Line | DDB Book Value |
|---|---|---|---|
| 1 | $4,000 | $2,000 | $6,000 |
| 2 | $2,400 | $2,000 | $3,600 |
| 3 | $1,440 | $2,000 | $2,160 |
| 4 | $864 | $2,000 | $1,296 |
| 5 | $518 | $2,000 | $778 |
⚙Formula Breakdown
💡Depreciation Method Tips
Buy a new car? Watch your investment depreciate instantly. The loss isn’t something you feel; it’s math. Linear models fails to capture the phenomenon more accuratley called exponential depreciation. Humans tend to think that stuff devalues gradualy over time (it loses a set number of dollars every year). In truth, an asset will lose its greatest value during its earliest years.
To reflect this, use a declining-balance method, which doesn’t subtracts a fixed dollar amount from initial cost. Instead, it takes a fixed PERCENTAGE of whatever remains. That’s why the result form a descending curve: a sharp plunge followed by gradual decrease. Reality follows a similar pattern, as new value fade in the marketplace.
Understanding How Things Lose Value
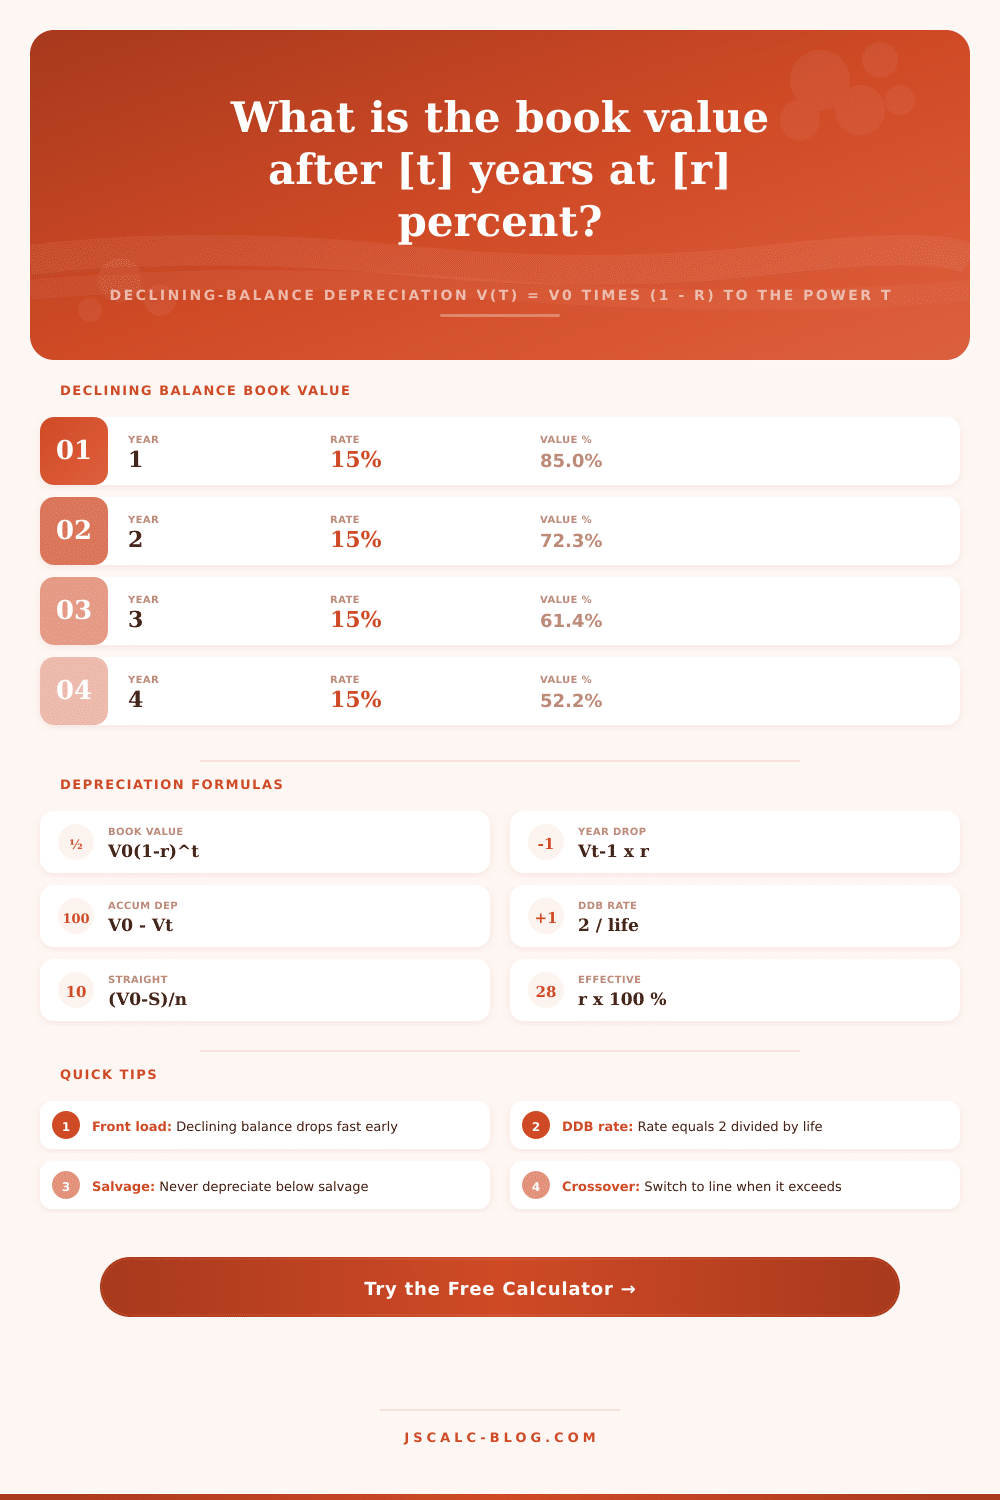
That’s the core calculation. It’s simple and strong. Book value = (original cost) x (survival rate)^(years). Assuming an annual survival rate of 85%, that means you lose 15% of the rest. That difference between 15% of a number versus 15% of a different number are significant… It’s the difference between losing 15% of $10,000 vs. That is losing 15% of $6,000. The former is larger in total terms then the latter. This creates an exponential decay curve: As time goes on, the amount decreases more slow.
Adjust the “elapsed years” input to see how this works. How much is your asset worth today? That’s its current paper value. This gets at a tension: speed vs. Sustainability. The former take the form of straight-line depreciation, which evenly spreads costs across lifetime of thing. It is predictable. The latter is more aggressive (i.e., declines): it writes big chunks off in year one, front-loading the expense.
This matches tax code preferences, which permit rapid write-offs of equipment. But it provides little contribution to depreciation in later years. The calculator display this side-by-side. You’ll notice where the two curves meets. That’s the crossover year: after this date, switch to straight-line; you’re charging less than the flat rate per year.
A salvage floor protect the asset. It’s like a safety net. Otherwise, the math says that at some point the asset should of be worthless. That’s never true in practice. Something’s always got trade-in value or scrapping value. A reasonable salvage floor keeps book value out of the red zone. It maintains the accuracy of accumulated depreciation, preventing you from writing off more than the thing can possibly depreciate for.
By neglecting a salvage floor, your initial numbers is too rosy. Eventually they stop matching economic reality. Presents fill the gap between real-world things and abstractions. Under double declining, office furnitures may have a 10% depreciation rate per year, while laptops may be 40%. The reasoning behind this is that a chair wears out slowly over time, but tech loses value rapidly as it becomes outdated.
Don’t worry about having to remember all of these standards. With just a couple of clicks, you can run some scenarios. Twist knobs on lifespans and rates to see what makes your bottom line twitch. A small adjustment in assumptions… Like changing your computer’s lifespan from eight years to five, can greatly shift the outcome.
Depreciation is realy just a matter of timing. It’s a question of when to account for your purchases as expenses. Early years favor the exponential method. That’s great for cash flow (if you’re taxed on net income). And it takes some thinking beyond “divide by ten.” But it also better matches the real-life lifespan of capital goods.
When you understand the shape of the curve, it no longer feels like random numbers. You hear the story behind them: wear & tear, market forces, etc.