RNA Molarity Calculator
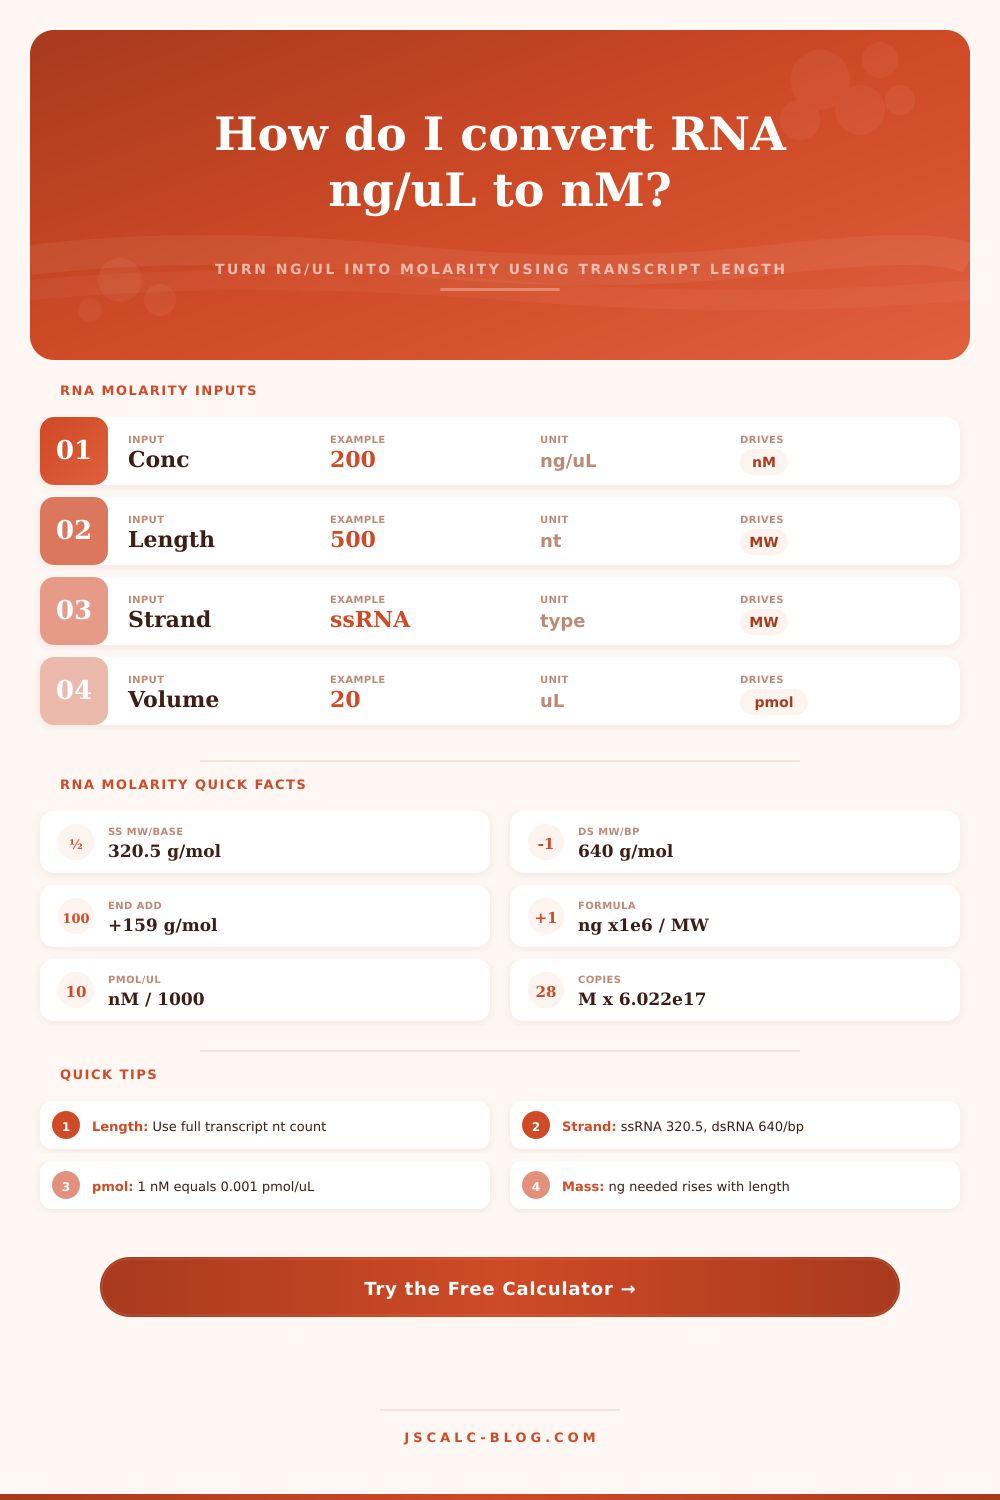
Convert an RNA concentration in ng/µL into molarity (nM or µM), pmol per µL, and copies per µL using the transcript length and average ribonucleotide mass. See molecular weight and the ng needed for a target pmol amount.
🧬Real RNA Presets
📝RNA Sample Inputs
Reading from a Nanodrop or Qubit, equal to µg/mL.
Nucleotides for ssRNA, base pairs for dsRNA.
Used for total moles, mass, and copies in the tube.
Calculator returns ng and µL needed for this many pmol.
🔢Formula Snapshot
🧪Average Nucleotide Mass Reference
| Ribonucleotide | Symbol | Monophosphate MW | Notes |
|---|---|---|---|
| Adenosine | A (AMP) | 329.2 g/mol | Purine, heaviest base |
| Guanosine | G (GMP) | 345.2 g/mol | Purine, highest MW |
| Cytidine | C (CMP) | 305.2 g/mol | Pyrimidine |
| Uridine | U (UMP) | 306.2 g/mol | Replaces T in RNA |
| Average | N | 320.5 g/mol | Used for mixed-base ssRNA |
📏Common RNA Lengths
| RNA Type | Typical Length | Strand | Approx MW |
|---|---|---|---|
| Mature miRNA | 21 to 23 nt | ss | ~7,090 g/mol |
| siRNA duplex | 21 bp | ds | ~13,599 g/mol |
| tRNA | 76 nt | ss | ~24,517 g/mol |
| sgRNA (CRISPR) | ~100 nt | ss | ~32,209 g/mol |
| GFP mRNA | ~996 nt | ss | ~319,377 g/mol |
| 16S-like rRNA | ~1900 nt | ss | ~609,109 g/mol |
📈ng/µL to nM Examples (ssRNA)
| Length | MW (g/mol) | At 50 ng/µL | At 100 ng/µL | At 200 ng/µL |
|---|---|---|---|---|
| 22 nt | 7,210 | 6,935 nM | 13,870 nM | 27,739 nM |
| 100 nt | 32,209 | 1,552 nM | 3,105 nM | 6,209 nM |
| 500 nt | 160,409 | 312 nM | 623 nM | 1,247 nM |
| 1000 nt | 320,659 | 156 nM | 312 nM | 624 nM |
| 2000 nt | 641,159 | 78 nM | 156 nM | 312 nM |
| 4000 nt | 1,282,159 | 39 nM | 78 nM | 156 nM |
🗂RNA Molarity Comparison Grid
| RNA Type | Length | MW (g/mol) | nM at 100 ng/µL | pmol/µL | Copies/µL at 100 ng/µL |
|---|---|---|---|---|---|
| miRNA | 22 nt | 7,210 | 13,870 nM | 13.87 | 8.35e12 |
| siRNA duplex | 21 bp | 13,599 | 7,353 nM | 7.35 | 4.43e12 |
| tRNA | 76 nt | 24,517 | 4,079 nM | 4.08 | 2.46e12 |
| sgRNA | 100 nt | 32,209 | 3,105 nM | 3.10 | 1.87e12 |
| IVT transcript | 1000 nt | 320,659 | 312 nM | 0.31 | 1.88e11 |
| Luciferase mRNA | 1650 nt | 528,984 | 189 nM | 0.19 | 1.14e11 |
| rRNA | 1900 nt | 609,109 | 164 nM | 0.16 | 9.89e10 |
| mRNA vaccine | 4000 nt | 1,282,159 | 78 nM | 0.08 | 4.70e10 |
⚙Full Formula Breakdown
📋Strand and Factor Reference
| Item | Value | Where It Applies | Effect on Molarity |
|---|---|---|---|
| ss average base | 320.5 g/mol | Single-stranded RNA | Lower MW, higher nM |
| ds average pair | 640 g/mol | Double-stranded RNA | Higher MW, lower nM |
| End correction | +159 g/mol | 5′ triphosphate approx | Small drop at short lengths |
| ng/µL to nM | × 1e6 / MW | Any concentration reading | Direct molarity conversion |
| Avogadro | 6.022e23 /mol | Copy number counting | Sets copies per mole |
💡Practical RNA Molarity Tips
You want to order some siRNA and you sit down to do it and realize that twenty nanograms per microliter isn’t the same thing as twenty nanomolar. This is especially true if your transcripts is all over the map in terms of their lengths. In the end, mass concentration doesn’t tell you how many molecules are in the tube. That is what the difference between ng/uL and nM (nanomolar) represents. It is the difference between routine lab work and precision experimentation.
Downstream applications such as CRISPR guides or reverse transcription particularly care about number of molecules, not just their raw weight… And they’ll let you know. The calculator up top will run numbers for you. It takes into account exact length and strandedness of your RNA molecule to convert those ng/uL figures into something meaningful: molarity units.
Why Molarity Is Better Than Weight for RNA
This brings us to the heart of our problem: transcript length scales directly with its molecular weight. Your 22-nucleotide microRNA is ~7,000 daltons; your four-thousand nucleotide mRNA vaccine construct? More like one million daltons. What does that mean? For every unit mass of total RNA, the molarity (concentration) of your shorter molecule will be orders of magnitude greater than your longer molecule. Ignore this variation and assume the same conversion factor apply between two distinct sample, and you’ll either drown your reaction in surplus template or starve it. It’s a small detail, but it breaks reproducibility faster then any pipette mishap.
An average nucleotide has a mass of around 320.5 grams per mole; however, these numbers need to be doubled for double-stranded molecules and you should of remember to account for the molecule’s ends (a triphosphate or phospho group at either end increases the mass by ~159 daltons). For long transcripts, this adjustment won’t make much difference; however, if you’re dealing with short oligonucleotides, then that additional weight will make up more of total mass. Most people don’t think of this, which lead to small errors during stock prep or primer design.
Knowing the number isn’t enough; you also need to understand what it means. Molar concentration (nanomolarity) is critical if you’re setting up hybridization reactions, because speed of binding depends on the number of molecules present. An intermediate unit, picomoles per microliter. Is helpful in seeing amount of material being dispensed in small volume scenarios. Copies per microliter bridges the gap from spectrophotometer readout to the quantification scale of qPCR, and can helps you relate your measurements directly to the number of copies in a standard curve.
This is laid out clearly in the reference table on the page, which shows rate at which molarity drops with increasing length for common RNA types. Before you go and make any dilutions, you ought to consider these calculations. When you’re creating a ribosome profiling library, for example, you want to be aware that your 500-nucleotide spike-in control isn’t realy at the same molarity as your 21-nucleotide miRNA sample. This ensures your normalization factors won’t be skewed later on.
It compels you to acknowledge the physical reality of your molecules, instead of thinking of all the RNA in your reactions as interchangeable sludge. You make adjustments to your volumes to ensure that each reaction get the amount of functional units you intend them to get. Once you know how to get your inputs right, the math itself isn’t complicated, though taking the time to check length and strandedness each time will save you hours of troubleshooting later on.
Guessing costs a lot, while precision have no penalty. If your control behaves just as you expect and your final data is clean, then chances are that somebody paid attention to the count vs. Weight distinction from the very beginning. What might have been a potential source of error becomes a simple step in a strong workflow, where you don’t need to chase down phantom efficiencies anymore; instead, you can trust your reagents.