Return Loss Calculator
Compute return loss in decibels from VSWR, reflection coefficient magnitude, an impedance mismatch, or a reflected-to-incident power ratio. The tool reports return loss as a positive dB value along with the reflection coefficient, the equivalent VSWR, and the percentage of power reflected back to the source.
📡Choose an Input Method
🎯Real Component Presets
📝Return Loss Inputs
Ratio of max to min voltage on the line, 1.0 is a perfect match.
Between 0 (matched) and 1 (total reflection).
Characteristic impedance of the line, commonly 50 or 75 ohms.
Real part of the load seen at the line end.
Forward power delivered toward the load.
Power bounced back from the mismatch.
Controls rounding on every result card.
🔢Formula Snapshot
📋VSWR to Return Loss Reference
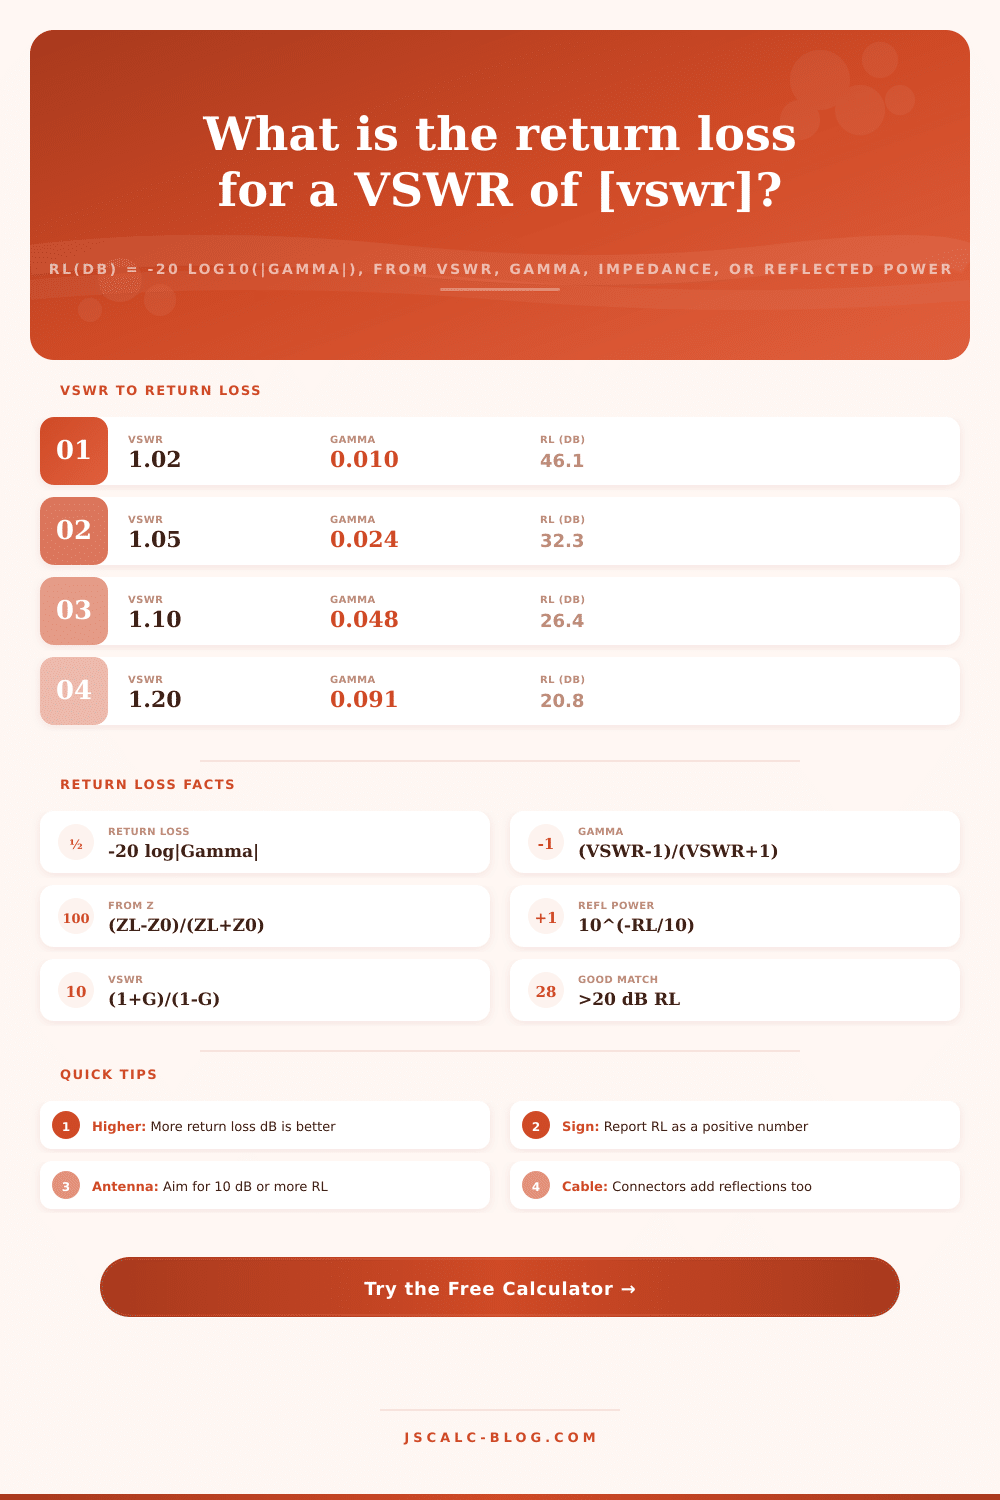
| VSWR | |Gamma| | Return Loss | Match Quality |
|---|---|---|---|
| 1.02 | 0.010 | 46.1 dB | Lab grade |
| 1.05 | 0.024 | 32.3 dB | Excellent |
| 1.10 | 0.048 | 26.4 dB | Very good |
| 1.20 | 0.091 | 20.8 dB | Good |
| 1.50 | 0.200 | 14.0 dB | Acceptable |
| 2.00 | 0.333 | 9.5 dB | Marginal |
| 3.00 | 0.500 | 6.0 dB | Poor |
| 5.00 | 0.667 | 3.5 dB | Bad |
📊Return Loss to Reflected Power
| Return Loss | |Gamma| | Power Reflected | Power Delivered | Mismatch Loss |
|---|---|---|---|---|
| 3 dB | 0.708 | 50.1% | 49.9% | 3.02 dB |
| 6 dB | 0.501 | 25.1% | 74.9% | 1.26 dB |
| 10 dB | 0.316 | 10.0% | 90.0% | 0.458 dB |
| 14 dB | 0.200 | 3.98% | 96.0% | 0.176 dB |
| 20 dB | 0.100 | 1.00% | 99.0% | 0.0436 dB |
| 30 dB | 0.032 | 0.10% | 99.9% | 0.0043 dB |
| 40 dB | 0.010 | 0.01% | 99.99% | 0.0004 dB |
🧩Impedance Mismatch on a 50 Ohm Line
| Load ZL | |Gamma| | VSWR | Return Loss | Common Case |
|---|---|---|---|---|
| 50 ohm | 0.000 | 1.00 | Infinite | Perfect match |
| 45 ohm | 0.053 | 1.11 | 25.6 dB | Tight tolerance |
| 60 ohm | 0.091 | 1.20 | 20.8 dB | Mild mismatch |
| 75 ohm | 0.200 | 1.50 | 14.0 dB | 75 on 50 ohm |
| 100 ohm | 0.333 | 2.00 | 9.5 dB | 2x too high |
| 25 ohm | 0.333 | 2.00 | 9.5 dB | Half impedance |
| 0 ohm | 1.000 | Infinite | 0 dB | Dead short |
🗃Match Quality Comparison Grid
| Rating | VSWR | |Gamma| | Return Loss | Power Reflected | Typical Use |
|---|---|---|---|---|---|
| Ideal | 1.02 | 0.010 | 46 dB | 0.01% | Calibration standard |
| Excellent | 1.10 | 0.048 | 26 dB | 0.23% | Precision connector |
| Very good | 1.20 | 0.091 | 21 dB | 0.83% | Base station antenna |
| Good | 1.50 | 0.200 | 14 dB | 4.0% | Handheld antenna |
| Acceptable | 2.00 | 0.333 | 9.5 dB | 11.1% | Broadband minimum |
| Marginal | 2.50 | 0.429 | 7.4 dB | 18.4% | Edge of band |
| Poor | 3.00 | 0.500 | 6.0 dB | 25.0% | Foldback likely |
| Bad | 5.00 | 0.667 | 3.5 dB | 44.4% | Severe mismatch |
| Total | Infinite | 1.000 | 0 dB | 100% | Open or short |
⚙Formula Breakdown
💡Practical Return Loss Tips
In radio frequency engineering, there’s this thing called return loss which confounds even seasoned engineers and many hams. What is it? Simply put, this calculator convert four different starting point into a single, trustworthy decibel number.
How? It starts with a signal traveling along a transmission line, encountering an end point (a load). The load may or may not be properly matched to the line, and if it isn’t, some portion of the signal will reflect back toward original source. Return loss represent how much power gets reflected. Got it?
What is Return Loss and How to Use This Calculator
Return loss will appear as a positive number. More is good: Less energy bounces back. That flip-flop catches many beginners off guard who think more = worse.
The formula is RL(dB) = -20 log10(|Gamma|). This is the defining equation. This means that we have to take absolute value (or size) of the reflection coefficient, Gamma, then take logarithm of that number. The logarithm are negative because magnitude of Gamma is always between zero and one. And because there is a minus sign at the start of the equation, it flip that number to make it positive.
Zero means no reflection from a perfect match and infinity dB return loss. One means 100% reflection from a short or open, which is no return loss in dB. All the good stuff fall somewhere in-between.
Plug in your numbers, and the calculator do all the logarithm number crunching for you. You shouldn’t of have to do it by hand on the bench.
Data comes at you in several ways. From VSWR, the tool first translates VSWR to a reflection coefficient (Gamma). From a reflection coefficient (Gamma), it goes right into dB. From impedance, it calculates Gamma as difference between your characteristic impedance and your load. Finally, from power, it reports reflected to incident power ratio. In each case, all roads lead to the same result cards.
The headline return loss is reported on the first card. The second provide the magnitude of reflection coefficient. The third shows the corresponding equivalent VSWR for comparison with results from an antenna analyzer. And the last report the percent of power that gets reflected. Taken together, these figures show a single mismatch from every practical perspective.
4 dB. Impedance mode: 5 at your operating frequency. 0 dB. So 4% of forward power reflect. That’s a solid match for most transmit antennas. And if instead you measured 75 ohms on a 50 ohm line, the impedance mode give you same numbers. The case of 75 ohms VSWR.
The log scale compresses a huge range of match quality into a readable span. A jump from 10 dB to 20 dB doesn’t sound like much, yet it represent reflected power falling from 10% down to 1%. It is a ten times improvement. Now only 1% reflects. This is why specification sheets lean on return loss rather than raw percentages.
There are three related quantities, best kept separate. Return loss refers to the reflected power. Mismatch loss refer to the tiny portion of the forward power lost due to that reflection. As long as the mismatch remain minor, this will remain tiny. Even at 14 dB return loss, the mismatch loss is still just about 0.18 dB.
VSWR is the older metric in the field; it’s directly related to Gamma. You’ll see all of these on this calculator, so there is no need to ever juggle conversion charts. Move easy back and forth between language of a handheld SWR meter and the language of a network analyzer.
The preset buttons loads values corresponding to real hardware, from a marginal antenna match through to perfect terminations. Start with the one most like your situation, then tweak numbers to match what you’ve measured.
Return loss is central to connector qualification, filter design, and antenna tuning. If return loss are bad you waste transmitter power. You cause foldback protection in an amplifier. With this tool, you can enter power, impedance, reflection coefficient, or VSWR to diagnose the problem in seconds. You can validate your filter passband and tune your rooftop antenna.
The calculator provide the dB you want and supporting numbers to back them up. It makes sure it’s not just the number you have to worry about but the number tell you about the energy going to your load. The same return loss that allows for the reflection also forms the standing wave pattern on the line. That completes the circle of understanding that started with that very first reflected voltage.