Cash Flow Calculator for Rentals
Estimate monthly rental cash flow, annual pre-tax cash flow, cash-on-cash return, expense ratio, reserve coverage, and debt burden from property-level income and cost assumptions.
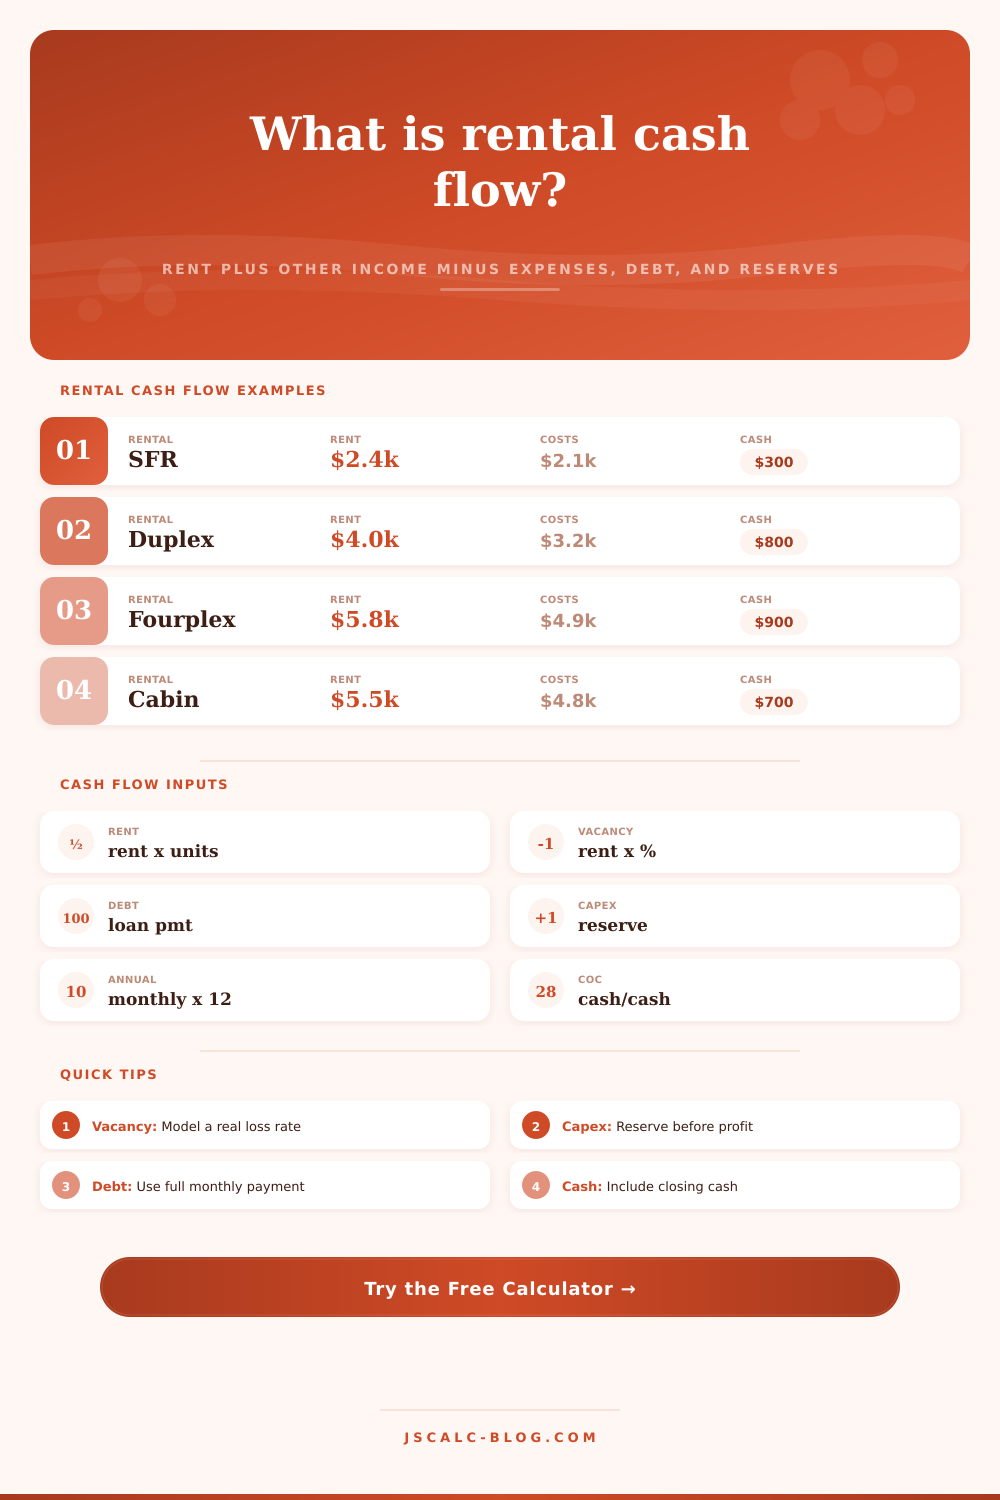
🏘Rental Cash Flow Presets
📝Cash Flow Inputs
Gross scheduled rent for one rented unit.
Use rentable units, not bedrooms.
Laundry, parking, storage, pet rent, or reimbursements.
Applied to scheduled rent plus other income.
Utilities, HOA, lawn care, admin, licenses, and non-listed costs.
Use the full monthly principal and interest payment.
Set to 0 for self-management.
Roof, HVAC, appliances, pavement, and big-ticket replacements.
Down payment, closing costs, initial repairs, and reserves funded at purchase.
📊Current Rental Snapshot
⚙Formula Breakdown
📋Expense Planning Table
| Line item | Calculator input | Typical basis | Cash-flow treatment | Watch item |
|---|---|---|---|---|
| Vacancy loss | Vacancy % | 3% to 10% for many long-term rentals | Reduces collected income before management | Use local and property history |
| Property taxes | Monthly taxes | Escrow statement or local tax bill | Operating expense | Reassessment after purchase |
| Insurance | Monthly insurance | Landlord or commercial policy | Operating expense | Premium jumps and deductibles |
| Management | Fee percentage | Commonly 6% to 10% of collected rent | Operating expense after vacancy | Lease-up and renewal fees |
| Repairs | Monthly repairs | Flat reserve or percent of rent | Operating expense | Older systems and turnover |
| Capex reserve | Monthly capex | Replacement reserve | Shown below NOI before cash flow | Roofs, HVAC, appliances |
| Debt service | Mortgage payment | Principal and interest payment | Subtracted after operating expenses | Rate resets and balloon dates |
🏢Preset Benchmark Table
| Preset | Units | Rent/unit | Vacancy | Debt | OpEx + capex | Monthly cash flow | Cash-on-cash |
|---|
📈Cash Flow Interpretation Table
| Monthly result | Cash-on-cash result | Quick read | What to inspect | Next check |
|---|---|---|---|---|
| Negative | Below 0% | Property needs cash support | Debt, tax, vacancy, repair assumptions | Stress-test reserves |
| $0 to $100/unit | 0% to 3% | Thin cushion | Capex and rent stability | Vacancy sensitivity |
| $100 to $250/unit | 3% to 7% | Moderate cushion | Management and maintenance history | NOI trend |
| $250 to $500/unit | 7% to 12% | Strong screening result | Lease quality and deferred work | Debt coverage |
| Over $500/unit | Over 12% | Very strong or unusual | Data accuracy and hidden expenses | Full underwriting |
🔍Vacancy Sensitivity Table
| Scenario | Vacancy rate | Effective income | Monthly cash flow | Annual cash flow | Cash-on-cash |
|---|
💡Practical Cash Flow Tips
“The numbers on paper made it look like a good deal. You purchased the rental property. The renters pays the mortgage each month, and there is a little extra to spare! Your agent told you it will be passive income for decades.”
Fast-forward to November: Water heater dies. In January, the roof need patching. One of your tenants move out without notice, and now you’re stuck with pile of cleaning bills and an empty apartment as your bank balance shrinks at a rate you never anticipated.
Real Costs of Renting Out Property
That’s what most people don’t see. Rent, mortgage = cash flow is not the full picture. It’s the real-world gap between what comes in and everything else that goes out, even expenses you forget about until they occur.
Enter your own cost inputs into the calculator above and let computer do the rest… Instead of guesstimating how much “extra” might be necessary for the future.
Cashflow is not a fixed amount; it’s a variable based off vacancies, repair cycles and tax reassessments. (When was the last time someone paid for electricity?) So most first-timers treats cash flow as a single figure. They see that gross rent. And they’re staring at their version of a fantasy.
You should of model real life by including management fees, wear-and-tear, and times when nobody pays the bills. First, establish a realistic vacancy loss. Five percent may sound like plenty; until you calculate it’s almost six weeks of zero income every year! Turnover in most markets is actualy slower than that.
Next, include operating expenses. Insurance and property tax is simple: easy to locate. But it’s maintenance and repair where deals gets made or broken. Older properties requires very little maintenance, right? Wrong. Roofs, plumbing, and HVAC all has minds of their own and they fail at their own pace. They don’t follow your wallet.
So the tool prompts you to set aside reserves for large costs, those “capital” expenses which will bust the bank if you cannot foot the bill for replacements when necessary. Accounting profit doesn’t mean anything if you’re broke.
Optimism can also run wild when it comes to debt service. Don’t plug in only the interest rate, plug in total debt servicing, including principal and interest. That’ll get even more interesting if you’re house hacking a triplex or duplex (i.e., you live in one unit, rent out two). That lowers your cost of housing, but messes up the cash flow scenario.
The example table on the page demonstrates some of the variables. Why an urban condo with a heavy HOA fee may differ than a suburban single family home. Your objective is to achieve a positive number but also to create enough of a buffer so one bad month doesn’t turn into a bad quarter.
Generally speaking: if you’re under a three-percent cash-on-cash return, you’re working for the bank, not building wealth for yourself. If your return falls within the seven to twelve percent range, and your maintenance history checks out, you’ve got something solid there. Check closely at the expense ratio. If you’re taking in over seventy-five percent of your effective income in operating costs, you don’t have much wiggle-room if interest rates goes up or rents slow.
Many people skip the capex reserve because it’s hard to feel like we’re throwing away money that doesn’t exist (yet). But skipping it is postponing the bill. Your roof won’t knock on your door asking whether you’ve been saving up. Forcing yourself to include this reserve in your monthly model is a way of paying your future self today. It keeps your cash flow even, avoiding those “oh s, I have no choice” loans/credit card charges which kill returns.
All-in-all, then, renting out is just a margin-management game. Your goal is to have big margins on both sides: small disruptions shouldn’t cause you to topple over. The calculator lets you see those margins upfront, before you sign any contract. When you know the drivers behind those numbers, you stop being lured by fat rents; you manage risk instead. And that makes all the difference when the water heater inevitable gives up the ghost this coming winter.