Gross Rental Yield Calculator
Calculate gross yield from annual gross rent and property value, then compare vacancy-adjusted yield, rent growth, valuation basis, and closing-cost basis.
Use the value that matches the selected valuation basis.
Enter scheduled monthly rent for one rentable unit.
Residential units, suites, cabins, or rent-producing spaces.
Parking, storage, pet rent, laundry, bill-back rent, or similar recurring income.
Used only for the secondary vacancy-adjusted yield.
Projects next-year scheduled gross rent and yield.
Changes the acquisition-basis yield card, not the core formula.
Keep this consistent when comparing similar properties.
| Metric | Formula | Used for | Notes |
|---|---|---|---|
| Annual base rent | Monthly rent x units x 12 | Core rent roll | Uses scheduled rent before vacancy. |
| Annual gross rent | Base rent + other recurring rent income | Gross yield numerator | Add only recurring rental income. |
| Gross rental yield | Annual gross rent / property value x 100 | Main result | This is a revenue-level screen, not an expense model. |
| Vacancy-adjusted yield | Annual gross rent x (1 - vacancy %) / value x 100 | Secondary result | Keeps vacancy separate from the gross formula. |
| Acquisition-basis yield | Annual gross rent / (value + closing basis) x 100 | Closing-cost check | Shows yield after adding the selected basis option. |
| Property type | Lower screen | Middle screen | Higher screen | Watch item |
|---|---|---|---|---|
| Urban condo rental | 3% to 5% | 5% to 7% | 7%+ | HOA dues and rent caps |
| Single-family rental | 5% to 7% | 7% to 10% | 10%+ | Repairs and leasing friction |
| Duplex or triplex | 6% to 8% | 8% to 11% | 11%+ | Unit condition and utilities |
| Small multifamily | 7% to 9% | 9% to 12% | 12%+ | Collections and capex |
| Student rental | 7% to 9% | 9% to 13% | 13%+ | Turnover and summer vacancy |
| Vacation rental | 6% to 9% | 9% to 14% | 14%+ | Seasonality and regulation |
| Basis option | Best use | Pros | Limit | Comparison note |
|---|---|---|---|---|
| Purchase price | Acquisition screening | Simple and observable | May exclude repairs | Common for deal snapshots |
| As-is market value | Hold or refinance review | Reflects current market | Needs recent comps | Useful after price changes |
| Appraised value | Lender-aligned review | Third-party support | Can lag market rent | Pair with rent roll date |
| After-repair value | Stabilized projection | Matches upgrade plan | Can overstate current yield | Label as projected |
| Portfolio value | Multi-asset reporting | Consistent internal basis | Can hide asset variance | Break out by property type |
| Scenario | Value | Monthly rent | Units | Other income | Vacancy % | Annual gross rent | Gross yield | Vacancy yield | Next-year yield |
|---|
A first glance at a property’s income potential, known as gross rental yield, provides insight into the actual dollars-and-cents potential of an investment, regardless of tenant turnover or plumbing leaks. No complicated pro forma required here. If a property check out here, it’s worth looking into. It is just a simple, quick screen.
Plug in your numbers (property value and rent), and let the calculator above handle math for you. Save yourself time trying to guess which percentage checks out, and which doesn’t.
How Gross Rental Yield Works
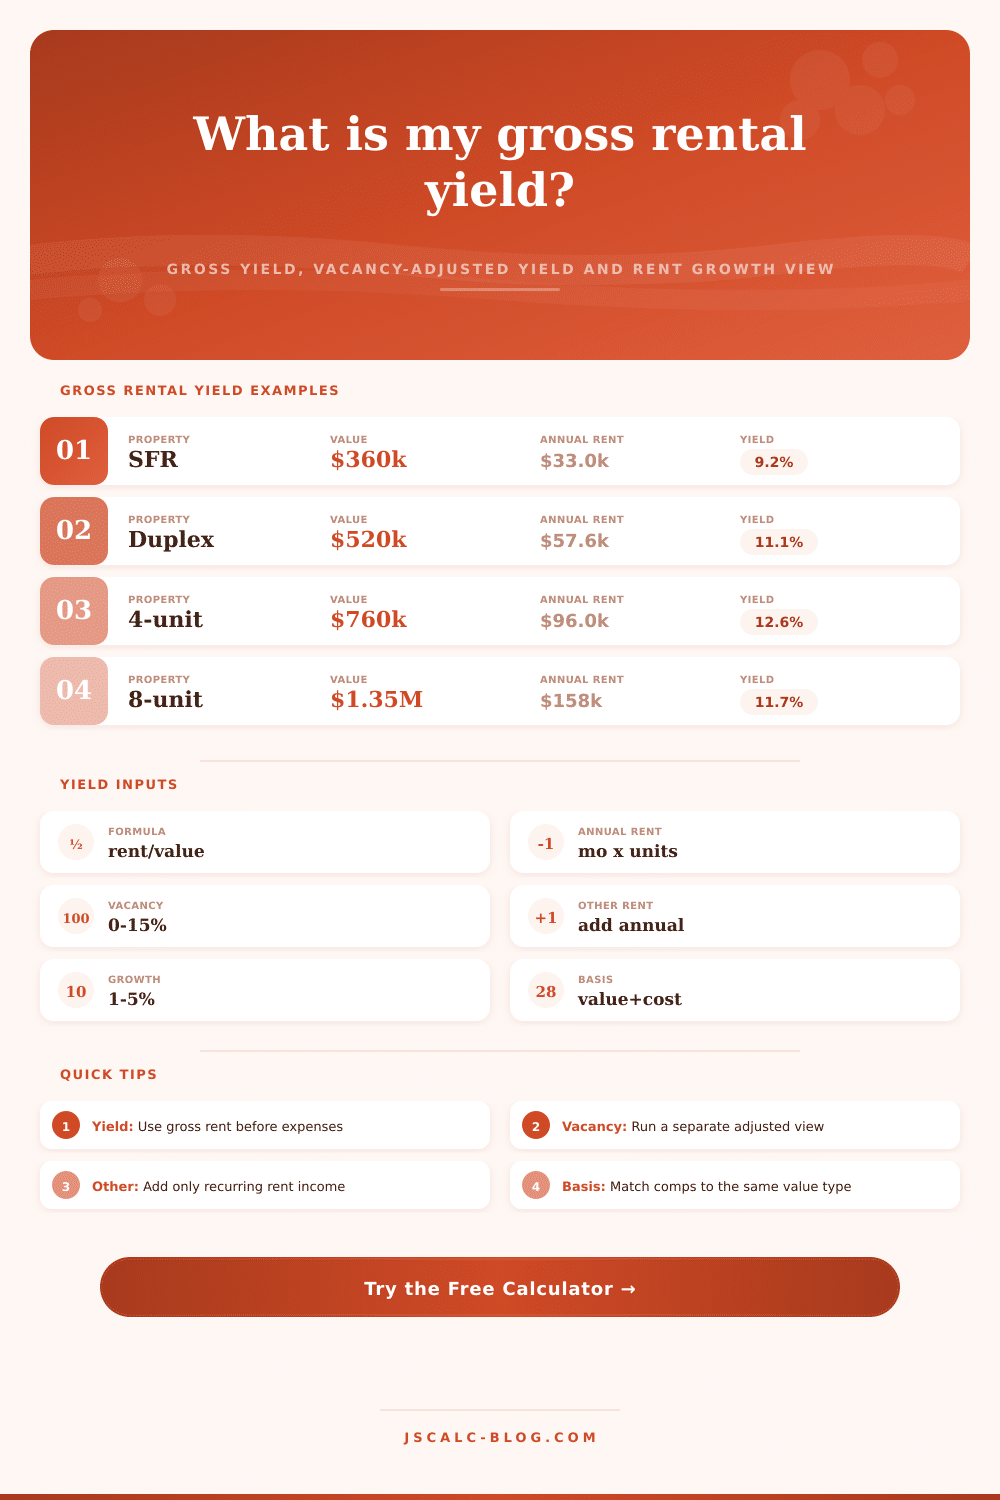
So what’s the simple formula? Divide the annual gross rent by the value of the property. This will be a percentage. It represents a baseline measure of the cash flow generated from the property before deducting expenses.
Here’s the twist: what do you include when you say “rent”? Answer: you want the number of unit times the scheduled monthly rent, plus an extra year (twelve months) to get the annual amount. And if you’ve got laundry, storage, or parking income that’s recurring and predictable. Toss that in. Keep the top number clean and focused on solid income streams, not one-off fees.
And then there’s reality. Theory doesn’t account for vacancy. No property are 100% occupied each month of the year. One tenant leaves for work, one gets a repair between tenants, and marketing require time. To reflect this, the tool allows you to input a vacancy percentage, and see how this hole will cut into your theoretical yield. In a stable market, five percent may seem conservative; with seasonal rentals or student housing, it can swing much wider. It helps show you what kind of cash you can actualy count on collecting, not simply what’s listed on the lease.
That percentage depends entirely on how you measure the value of the property. Do you measure it based off the purchase price? Appraised value? After-repair valuation? Comparing them all causes comparison errors that can make bad deals appear attractive. For instance, if you purchase a fixer-upper house, its raw purchase price could result in a huge return. But when you account for the renovation costs within your acquisition basis, that percentage will shrink dramaticaly. You can toggle different closing cost assumptions and see how transaction friction affect your return. It is a small detail, but it keeps buyer’s remorse at bay when you get your closing statement.
Next, there’s the potential for rent growth. Rent rises with inflation; markets change; leases turn over. A small rate of annual growth helps you imagine your yield not only at closing but also year two and three and beyond. That future-looking perspective is what distinguishes dynamic investments from those that are merely static. You’re purchasing a dynamic stream of cash flow.
This will look different depending on the type of properties we’re looking at. With a single family home, there could be a lot more expenses upfront (acquisition cost) and ongoing (maintenance), which can lower the yield. Economies of scale tend to increase the yield for multi-units. HOAs can limit growth potential for urban condos. The downside may be increased tenant turnover, but they’ll give you strong early cash flow. Understanding what the average return is for the asset class you’re targeting will help set your expectations. If you’re finding 4 when everyone around you is getting 8 in the same area, it’s probably because either rent estimates are off or the price is too high.
To conclude. Gross yield is a screening metric. A yes-or-no decision? Nope! Instead, it indicates whether a property merit deeper investigation. If the percentage catches your interest, then you dig deeper into cash-on-cash returns, cap rates, and net operating income to confirm the profitability. But before you do, you run the risk of pursuing seemingly awesome-looking deals that is blood-bags in real life. You should of kept your assumptions honest. Ensure you’re basing your valuations on your strategy. And know that a high-yield property with zero vacancy cushion is little more than an illusion about to pop.