Net Rental Yield Calculator
Calculate net rental yield from annual rent, vacancy-adjusted income, operating expenses, property value, and optional purchase costs in the investment basis.
Market value or purchase price used as the base denominator.
Contract rent before vacancy loss.
Closing costs, due diligence, transfer tax, and initial acquisition fees.
Laundry, parking, storage, pet rent, or reimbursements.
Use all-in basis when you want acquisition costs included.
| Preset | Value | Units | Rent/unit | Vacancy | Net yield |
|---|---|---|---|---|---|
| Starter SFR | $360,000 | 1 | $2,650 | 4% | 5.54% |
| Sunbelt duplex | $520,000 | 2 | $2,100 | 5% | 6.14% |
| Urban condo | $485,000 | 1 | $3,900 | 4% | 5.53% |
| Midwest fourplex | $575,000 | 4 | $1,175 | 6% | 5.56% |
| Student sixplex | $925,000 | 6 | $1,525 | 8% | 7.14% |
| Vacation cabin | $540,000 | 1 | $5,850 | 28% | 4.89% |
| Garden 8-unit | $1,350,000 | 8 | $1,575 | 5% | 7.09% |
| Mixed-use Main St | $1,850,000 | 5 | $2,450 | 5% | 5.84% |
| Workforce 12-unit | $1,620,000 | 12 | $1,125 | 7% | 5.73% |
| Expense line | Input basis | Included in NOI | Useful cross-check |
|---|---|---|---|
| Property taxes | Annual dollar amount | Yes | Compare assessed value and local levy |
| Insurance | Annual premium | Yes | Use landlord or commercial policy quote |
| Maintenance | Annual repairs reserve | Yes | Older buildings usually need higher reserves |
| Management | Percent of collected income | Yes | Commonly modeled from effective income |
| HOA dues | Monthly per unit | Yes | Multiply by units and 12 months |
| Purchase costs | One-time acquisition amount | No | Only affects yield basis when toggled |
| Net yield | Quick read | What to verify | Next metric |
|---|---|---|---|
| Under 3% | Very low income return | Growth, land value, or personal-use assumptions | Cash flow forecast |
| 3% to 5% | Lower current yield | Premium market, HOA, tax reassessment | Rent growth sensitivity |
| 5% to 7% | Middle income range | Expense reserves and vacancy history | Cap rate and DSCR |
| 7% to 9% | Income-focused range | Repair risk, lease quality, local demand | Stress-tested NOI |
| Over 9% | High yield screen | Deferred maintenance, weak location, collections | Full due diligence model |
| Scenario | Property value | Effective income | Operating expenses | NOI | Expense ratio | Yield basis | Net yield |
|---|
Most folks begin their analysis with gross rental yield. It’s simple to calculate, and it looks good on a spreadsheet! Simply divide the purchase price by 12 months times the monthly rent. Sounds good, but guess what? Your property isn’t going to be rented out every day, of every month, of every year. There is always turnover. There is always time between tenants. Sometimes payments are late or never arrive. These rosy models don’t account for such thing.
But net rental yield does. It strips out the fantasy income, forcing you to deal with reality. It shows you how much this asset realy produces after operating expenses have taken their bite. With the right numbers plugged into calculator (above), you can let the software do the number-crunching to remove any guesswork about how much cash actualy remains.
Why You Should Use Net Rental Yield
The key figure here is the “vacancy” line: Most amateurs assume a fixed percentage, something they copy from an industry report or article without considering whether that figure applies to their own market conditions. For example, a four percent vacancy rate might be reasonable if you’re managing a steady, long-term tenant base in a stable suburban neighborhood, but it would be dangerously low if you were renting out student housing property or a vacation rental that swings wildly based on seasonality. You can play around with this percentage to account for the ups and downs of your local leasing scene; why? Because every day your unit sits vacant, it directly eats away at your net operating income.
Similarly, expenses are difficult, since few remains constant. Insurance (which depends off historical claims and weather) and property tax (which depends on re-assessment) do not typically remain the same over time. There is no rule of thumb for maintenance, such as replacing an aging HVAC system or roof. It depend on age of the systems. These breakdowns get their own line items within the calculator where you can model each accordingly.
Management fees are usually expressed as a percent of *collected* income, not gross potential income. This is a small detail, but it is very important. If your vacancies increase, your management fee should of actually decline to match (there’s simply less income for that manager to oversee!). That connection matters more then most investors think about when calculating their overall yield.
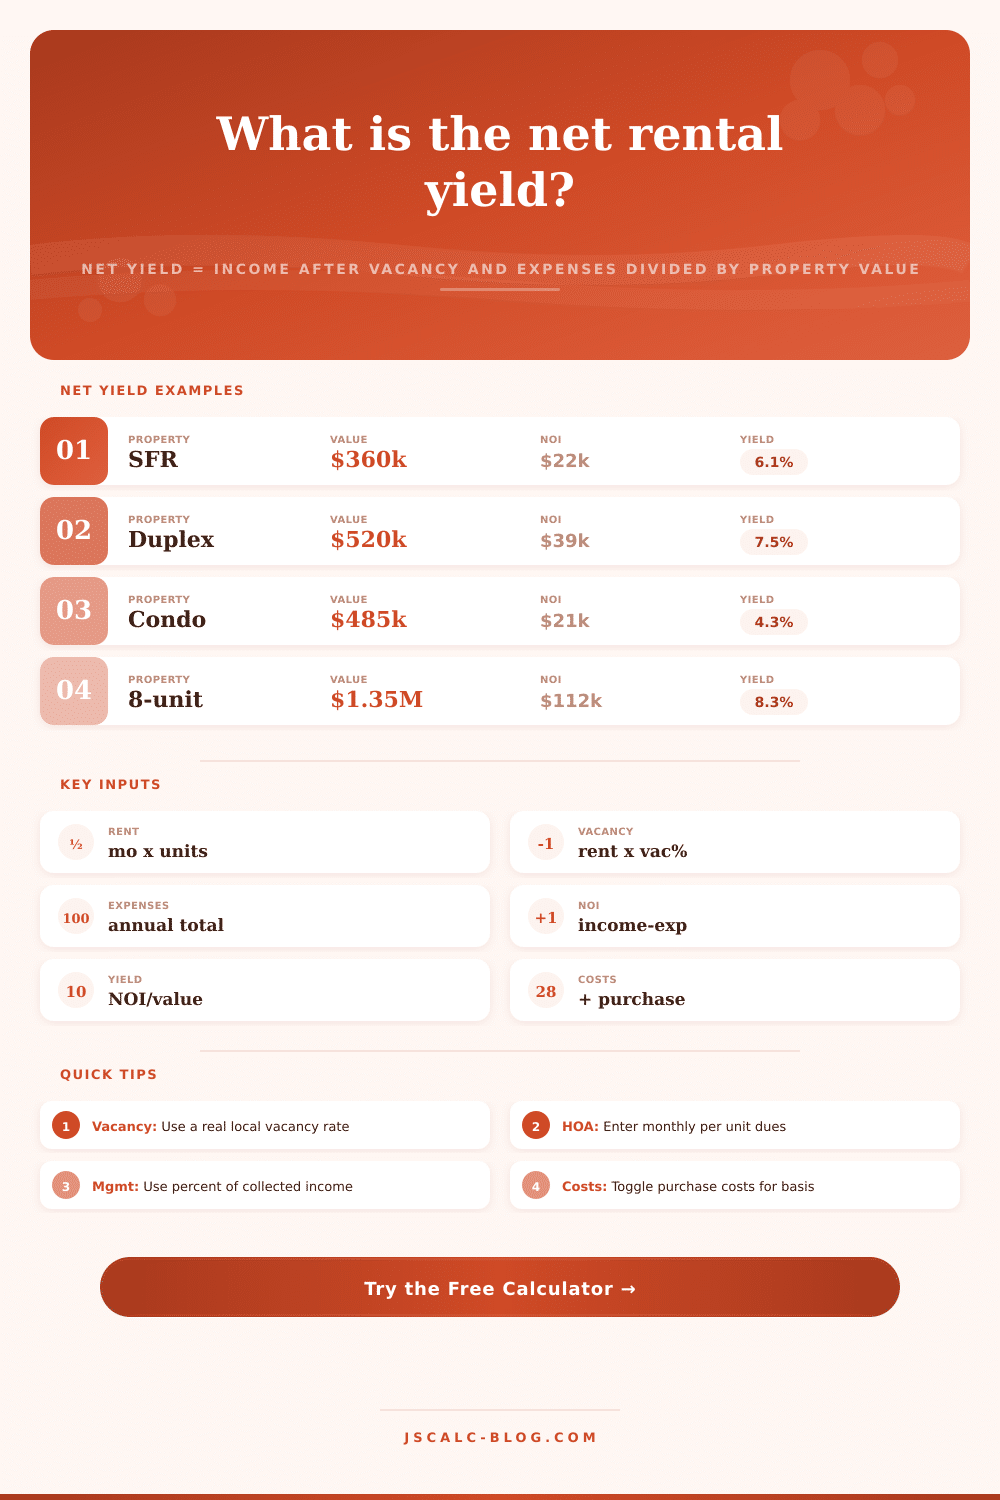
The other wrinkle here is the definition of “investment basis.” Do you count only the raw property price when comparing yield against appraised value or market cap rates? Or do you include all-in acquisition cost (initial repairs + closing fees + transfer taxes) in the denominator? If you take the latter view, then you are getting a true sense of your return on total dollars invested; otherwise, you’re ignoring the impact of acquisition costs on your actual return. The reference table on this page shows how different properties scales across different assumptions. For example, it shows how a seemingly good yield could actually look worse if there is greater acquisition friction or maintenance reserve required.
These aren’t predictions, treat them as a stress test. When factoring in realistic costs plus vacancy, if you’re getting less than three percent return, then you’re probably depending heavily on appreciation (or tax benefits) to pencil out this deal. That’s more risky, and it assumes much stronger faith in future market appreciation. Between 5-7 percent implies a well-balanced income property. One where cash flow play an important role. Eight percent-plus typically indicates increased risk factors such as unstable tenant turnover or an older building requiring deferred maintenance.
Don’t try to get the biggest number to show up on the screen; instead, use the number as an indicator of how much risk you are exposed to with this investment. A high net yield can mask other issues with the physical structure or lease quality. Meanwhile, a low net yield in a hot market may stay stable and have future growth potential that doesn’t show up when we look at raw income numbers. You want to balance out the short term cash gain vs. The longer term viability of the asset. The calculator gives you the baseline information.
Now it’s up to you if those numbers shows a viable investment or simply a time bomb until the next maintenance cycle hits. In the end, that’s the point of net rental yield: it makes things transparent. It takes all the polish off the pretty pictures and reveals the profit structure in its raw form. It requires you to pay attention to acquisition cost, insurance, taxes, and vacancy. It transforms vague optimism into cold, hard calculation. And that kind of honesty, that clear visibility (is far better than any top-line number).
You might be able to deceve yourself with hope, but when you have a precise understanding of your asset’s true earnings power (after all expenses) and how expensive it will be to own it … you can base decisions on reality. Not hope.