Net Operating Income Calculator
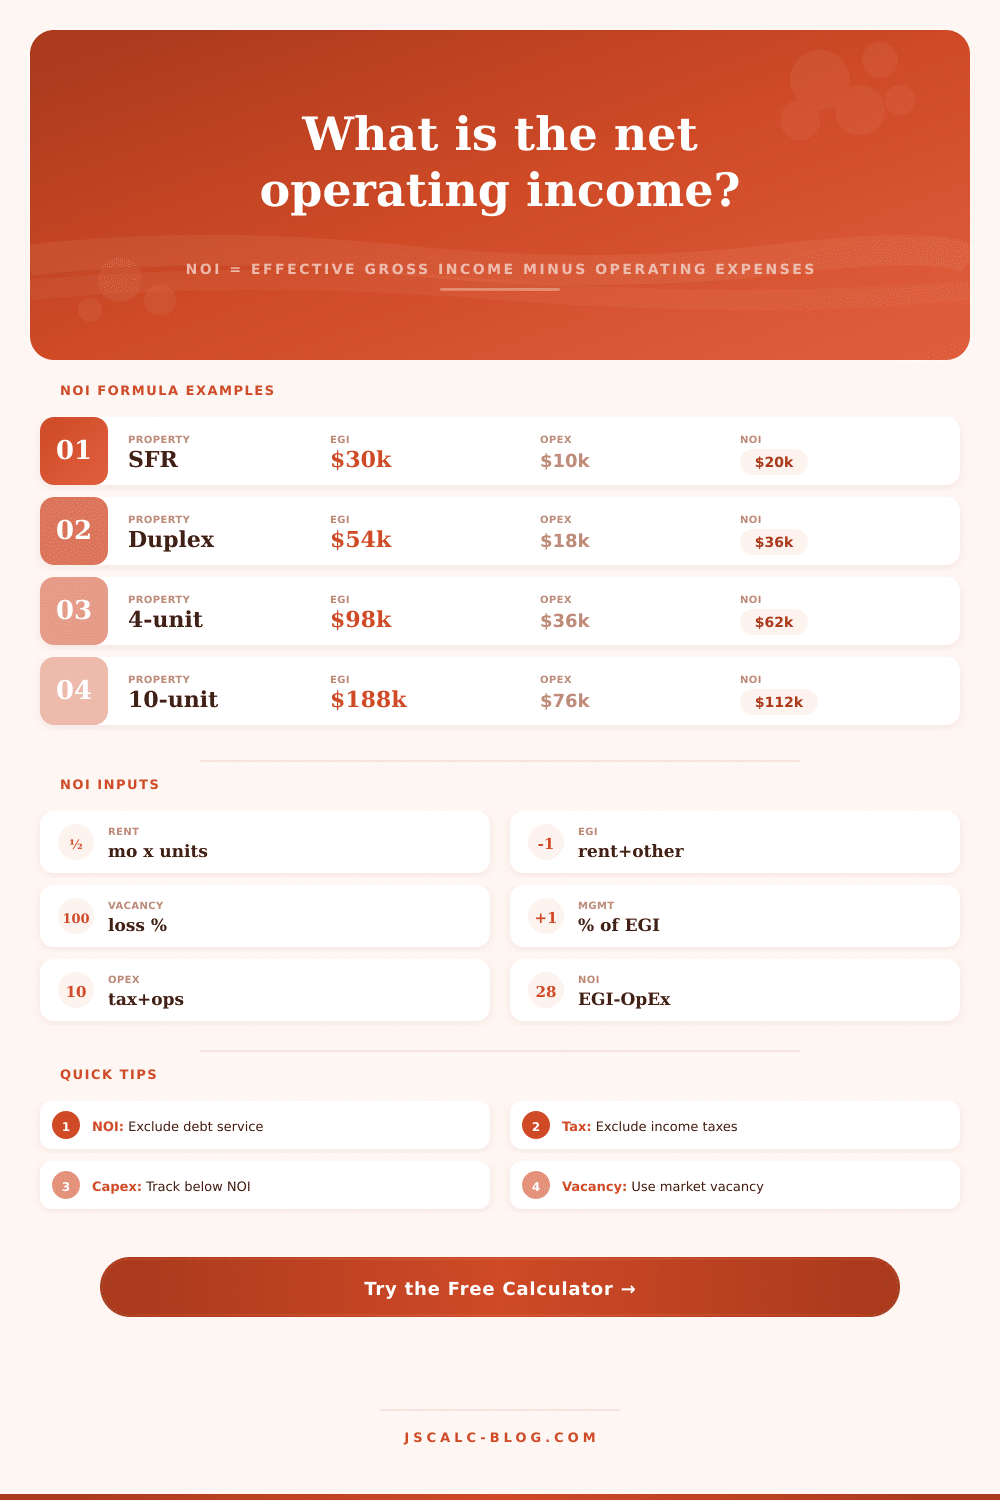
Calculate NOI from effective gross income and ordinary operating expenses. This JSCalc-Blog.com tool excludes debt service, income taxes, depreciation, and capital expenditures from NOI.
🏠Income Property Presets
📝NOI Inputs
Gross scheduled rent for one occupied unit before vacancy.
Use leasable rental units, suites, or spaces.
Laundry, parking, storage, pet rent, utility reimbursements, or fees.
Applied to gross scheduled rent plus other income.
Calculated from effective gross income, not scheduled rent.
Use recurring operating reserves only; keep capex below NOI.
📊Current NOI Snapshot
🧮Formula Breakdown
🏢Operating Expense Reference
| Line item | Included in NOI? | Common basis | Calculator input |
|---|---|---|---|
| Property tax | Yes | Tax bill or assessed estimate | Annual dollar amount |
| Insurance | Yes | Property policy premium | Annual dollar amount |
| Repairs and maintenance | Yes | Recurring upkeep and turns | Annual dollar amount |
| Management fee | Yes | Percent of EGI | Management percentage |
| Owner-paid utilities | Yes | Electric, gas, water, trash | Annual dollar amount |
| Operating reserves | Yes | Recurring reserve allowance | Annual dollar amount |
| Debt service | No | Financing below NOI | Exclude from NOI |
| Income taxes | No | Owner tax situation | Exclude from NOI |
| Depreciation | No | Non-cash accounting item | Exclude from NOI |
| Capital expenditures | No | Major replacements below NOI | Exclude from NOI |
📋Property Type Benchmarks
| Property type | Vacancy context | Management range | Expense ratio check |
|---|---|---|---|
| Single-family rental | Low when leased | 7% to 10% of rent | 25% to 40% of EGI |
| Townhome rental | Similar to SFR | 7% to 10% of rent | 25% to 42% of EGI |
| Duplex or triplex | One vacancy matters | 6% to 9% of EGI | 30% to 45% of EGI |
| Fourplex | Lease rollover spread | 6% to 9% of EGI | 32% to 48% of EGI |
| Small apartment | Market occupancy driven | 5% to 8% of EGI | 35% to 55% of EGI |
| Student housing | Seasonal lease-up risk | 7% to 10% of EGI | 38% to 58% of EGI |
| Mixed-use property | Residential plus commercial | 5% to 8% of EGI | 35% to 55% of EGI |
| Small retail property | Lease term dependent | 4% to 7% of EGI | 25% to 50% of EGI |
📑Preset Income and Expense Table
| Preset | Units | Rent/unit | Other income | Vacancy | NOI estimate |
|---|---|---|---|---|---|
| Suburban SFR | 1 | $2,650 | $0 | 3.5% | $20,000 |
| Townhome Rental | 1 | $2,950 | $300 | 4.0% | $22,800 |
| Duplex Rental | 2 | $1,850 | $900 | 5.0% | $29,600 |
| Fourplex | 4 | $2,400 | $3,600 | 5.0% | $79,200 |
| Garden 8-Unit | 8 | $1,525 | $6,800 | 5.5% | $90,400 |
| Workforce 10-Unit | 10 | $1,150 | $5,400 | 7.0% | $80,900 |
| Mixed-Use Building | 5 | $2,250 | $42,000 | 4.5% | $119,100 |
| Student Sixplex | 6 | $1,650 | $7,200 | 9.0% | $72,300 |
| Small Retail Strip | 6 | $3,800 | $9,600 | 6.0% | $187,600 |
🗂Five-Column Comparison Grid
| Scenario | Type | Annual rent | Other income | Vacancy loss | EGI | OpEx | NOI | Expense ratio |
|---|
💡Two Practical Tips
We all think we’ve cracked the code for rentals. We look at the building and notice the rent is X amount. Then we see how much the mortgage cost and assume we are good to go as long as it is positive. Seems right, right?
This changes when you need a serious loan or want to sell the building. All of a sudden, those number don’t add up. Here’s why: You’re analyzing cash flow, and cash flow depend on your personal debt load. Savvy investors and lenders analyze another number, prior to taking out a loan: net operating income (NOI). By removing the impact of your own bank accounts, NOI reveal the pure strength of basic asset.
How to Calculate Net Operating Income
So how do you do it? Enter your rough income and expenses into the calculator above and let it do the math. You will no longer mess with spreadsheets or risk screwing up the deal with an error.
First thing’s first: define your gross income. That means your effective gross income. Don’t simply add up all the rent you collect on paper, take out any vacancies. Vacancies happen, tenants move out, their lease ends, you have to spend money and time finding someone new. The vacancy rate you plug in here should of be based off history for your market. Not some optimistic guess. Otherwise, you’ll overestimate your income.
This is where you has to get strict on your spending. Obvious ones are property tax and insurance. Next are repairs and maintenance. To estimate, factor in the age of the house, including HVAC systems and general wear-and-tear. Management fees are confusing for many. Some owners pays a percentage of gross rent while others charge flat fees. You’ll see pro managers bill as a % of effective income. That’s what we ask.
Things paid by owner (utilities) goes here. Anything that keeps doors locked & lights on goes in this column.
Now the real test: What do you exclude? That’s where 99% of amateur analysis break down. You might feel compelled to subtract your mortgage payment; principal plus interest. Don’t do that. Mortgage interest (and other debt service) isn’t an operating expense; it’s a financing decision. The building still exists whether you owe millions on it or pay cash. Adding in your mortgage payment mix your financing terms with the health of the asset.
Income taxes get eliminated too. These depend on your specific tax situation, which varies from person to person and can change based off the tax code. These don’t impact the amount of cash the property throw off prior to distribution.
These are capital expenditures. Significant purchases like new boilers and roof replacements increases the long-term value of a property, but they’re not operating expenses. You’d never count them as such, otherwise, you’d find yourself lowering your annual income numbers so that you could convince yourself that you’re doing a good job despite screwing up in other areas.
Separating these out helps you see what’s really going on: the net number shows you how much money is being earned by the building itself. That way, you can look at two properties in two different cities, one cash-purchased and the other a leveraged buy-out, and you won’t get confused about the arithmetic.
Once you get it, everything about investing shift. Monthly cash flows are not always an indicator of a great investment. Instead, you focus on the efficiency of the building. Does it have a high expense ratio? That could be a sign of deferred maintenance. Do you assume a lower vacancy rate? That could mean you’re too optimistic about local demand. The calculator is giving you the snapshot. Your judgment tell you whether it’s a viable business or a risk.
This distinction provides a nice separation that will impress partners and lenders when sitting across from them. They’ll see you’re not guessing your take-home pay; they’ll see you grasp the mechanics of how to value a real estate investment. This isn’t a get-money-this-month activity; it’s about creating an asset that generates revenue consistantly for decades. You can achieve that clarity through net operating income. It cuts away the clutter so you hear the truth: what’s your property really worth? Trust the numbers, keep the lines clean, and let the building talk.