Gross Rent Multiplier Calculator
Calculate GRM from purchase price and annual gross scheduled rent, compare a target GRM price estimate, and keep vacancy-adjusted income separate from the core GRM.
Property price used in the GRM numerator.
Scheduled rent before vacancy or collection loss.
Laundry, parking, pet rent, storage, or utility reimbursements.
Used only for income comparison, not the main GRM.
Target price estimate = target GRM x annual gross rent.
Projects next-year scheduled rent for a quick sensitivity read.
| Market type | Typical GRM context | Income pattern | Comparison note |
|---|---|---|---|
| High-growth metro | Higher multiple | Rent growth driven | Compare to nearby closed sales |
| Core urban multifamily | Mid to high multiple | Low vacancy, higher other income | Separate retail or parking income |
| Stable suburban rental | Middle range | Predictable lease demand | Good for like-kind rental comps |
| Workforce housing | Often lower multiple | Rent-sensitive occupancy | Watch concessions and collections |
| Student housing | Seasonal multiple | Lease-up cycle matters | Use scheduled annual leases |
| Vacation rental | Wide range | Highly seasonal rent | GRM is only a rough screen |
| Small-town rental | Lower to middle range | Slower growth, local demand | Check vacancy history closely |
| Mixed-use income property | Blend of uses | Residential plus commercial income | Keep rent streams separate |
| Preset | Price | Units | Monthly rent/unit | Annual rent | GRM |
|---|---|---|---|---|---|
| Sunbelt duplex | $420,000 | 2 | $2,100 | $50,400 | 8.33 |
| Midwest fourplex | $575,000 | 4 | $1,150 | $55,200 | 10.42 |
| Coastal condo rental | $610,000 | 1 | $4,400 | $52,800 | 11.55 |
| Student sixplex | $900,000 | 6 | $1,475 | $106,200 | 8.47 |
| Garden apartments | $2,650,000 | 16 | $1,325 | $254,400 | 10.42 |
| Urban mixed-use | $1,850,000 | 5 | $2,450 | $147,000 | 12.59 |
| Vacation cabin | $540,000 | 1 | $5,750 | $69,000 | 7.83 |
| Suburban SFR rental | $355,000 | 1 | $2,650 | $31,800 | 11.16 |
| Workforce 10-unit | $1,150,000 | 10 | $1,050 | $126,000 | 9.13 |
| GRM result | Quick read | What to verify | Best next metric |
|---|---|---|---|
| Under 7 | Low price to rent | Condition, location, lease quality | Repair-adjusted cap rate |
| 7 to 9 | Often income-focused | Rent roll, vacancy, operating costs | NOI and debt coverage |
| 9 to 12 | Balanced screening range | Local sales and rent comps | Market cap rate |
| 12 to 16 | Growth or premium market | Rent growth assumptions | Cash flow forecast |
| Over 16 | Very high multiple | Land value, redevelopment, scarcity | Full valuation model |
| Scenario | Market | Price | Units | Annual rent | Other income | Vacancy % | GRM | Vacancy-adjusted income |
|---|
You stand on street corner, facing two brick buildings that are identical to one another. The listing price? Half a million dollars for one. Six hundred thousand for the other. Same building on exterior. Your wallet, however, give a damn about what’s going on behind those walls. Enter the gross rent multiplier.
It is not merely an entry on a spreadsheet. It is a rapid means of screening property before falling in love with new paint or the location.
What Is the Gross Rent Multiplier?
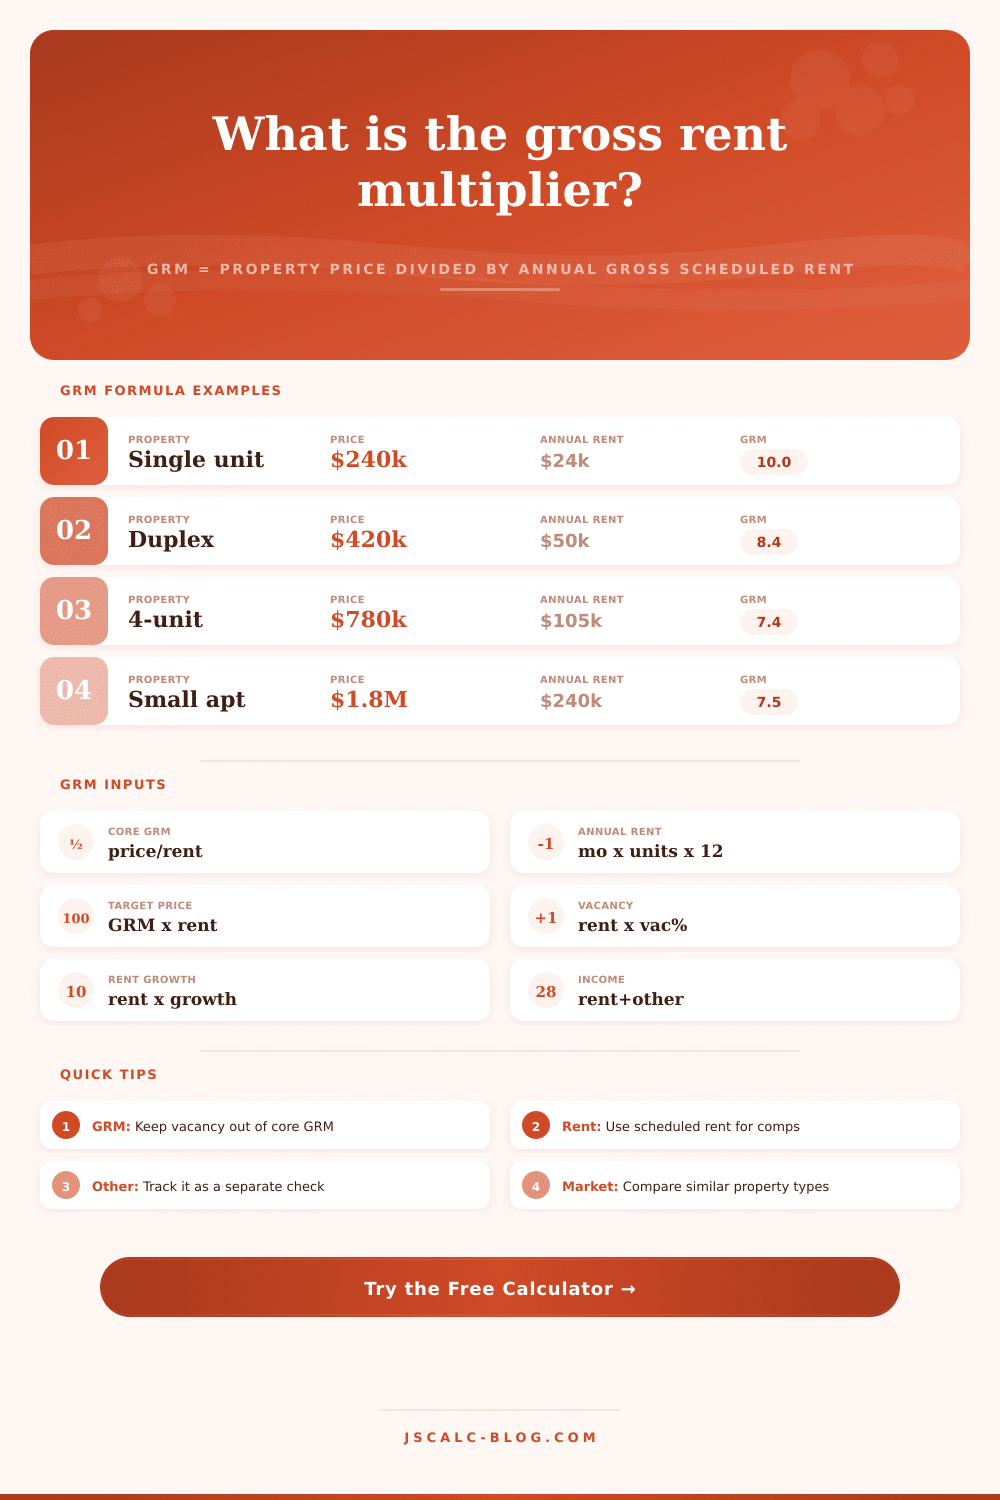
So what’s the solution? Use the calculator (above). Plug in the annual scheduled rent and your purchase price and let the calculator do the heavy lifting. It gets rid of all the clutter and lets you focus on single number: a ratio. Simply divide the purchase price by gross rental income in that first year. That’s it. That’s how we roll.
Now, here’s where most folks go wrong. Before they’ve established their baseline, they begin debating taxes, repairs, vacancy rates, etc. Yet at this stage, these isn’t relevant. Not to the gross rent multiplier. For the gross rent multiplier, you only need the raw income potential compared to entry price. These is two different concepts, and you don’t want them mixed together.
Mixing your vacancy losses into core equation will prevent you from making fair comparisons between different listing. The multiplier essentially serve as a loose estimate of the time required before your gross rent will repay your investment. Typically, the lower the multiplier, the more quick your rental property will be paid off.
Properties with gross rent multipliers in the 7-9 range is typically found in strong demand or stable market areas. These properties tend to focus on income, meaning they are cash-flow-oriented.
Here’s the catch: What exactly are we measuring? Price vs. Potential revenue. It is not profit. Profit occur downstream. Check out the reference tables they provide on page, which show how this changes based off the type of market. Because investors is chasing appreciation + rent growth (versus yield today), a high-growth metro will have higher multiples. A stable suburb may be somewhere in between.
You can use this as a way to enter a target gross rent multiplier into the tool and it’ll calculate what a fair purchase price would be for that kind of property. Basically it’s a sanity check. If your calculated GRM is 20 but comparable sales in the neighborhood are trading at 12, something is wrong. If it’s 20, then either the rent estimates are unrealistic, or the price is too high.
And note: don’t confuse “annual gross rent” with anything else. Use the scheduled rent. Not what tenants actualy paid (after concessions and late fees). What’s in the lease… That’s what they owe you.
The calculator has another output, labeled “vacancy-adjusted income,” which show the impact of empty units. This allows you to compare apples-to-apples against yourself over time, while keeping the core metric clean. It is a subtle difference. But it is crucial if you’re developing a financial model down the road.
Similarly, other income stream such as parking or laundry should be tracked separately. These add to the bottom line, but aren’t part of pure rent multiplier formula.
That’s why it’s such a mistake to stop at the gross rent multiplier and purchase the property without digging deeper. A low gross rent multiplier might be hiding a crumbling roof. It might also be an area with rising crime. It could of also be a lease roll stacked with month-to-month tenants that bail out every spring.
The multiplier is a screening device. It allows you to quickly say no to bad deals while giving yourself time to say yes to good deals. Before you write a check, you’ll want to run the numbers again, this time for cap rates, debt service coverage and net operating income.
So what? This tool is ultimately that bridge between curiosity and careful checking. That fuzzy thought “hmmm, I think this house is overpriced” becomes a tangible ratio you can use to compare with market data. Use it as an early filter for all those obvious mismatches so you can quickly eliminate them from the search process.
After you’ve used these crude multiples to narrow things down, you can then put more effort into the nitty-gritty analysis that settle the decision. Not looking for a property with a low number. Looking for a property whose numbers adds up when compared to the overall market.
Begin with the ratio. Confirm with the details. Let the data lead the way instead of your gut feeling.