Rental Property ROI Calculator
Measure the full return picture on an investment property: net operating income, cap rate, cash-on-cash return, plus principal paydown and appreciation combined into one honest total ROI figure.
🎯Real Deal Presets
📝Property & Return Inputs
All-in acquisition price of the property.
Trims gross rent to an effective figure.
Taxes, insurance, repairs, management. Exclude mortgage.
Principal and interest only, matching the mode above.
Loan balance reduction in year one; builds equity.
Down payment plus closing costs and rehab.
🔢Metric Snapshot
📊Return Component Breakdown
| Component | Source | Amount | Share of Return | ROI Points |
|---|---|---|---|---|
| Enter values above to split the total return into its parts. | ||||
📈Five-Year Projection
| Year | Property Value | Cash Flow | Paydown | Appreciation | Total Return | ROI % |
|---|---|---|---|---|---|---|
| The five-year outlook appears after calculation. | ||||||
Projection assumes rent, expenses, and paydown hold roughly steady while value compounds at the appreciation rate. Real deals vary; treat it as a directional guide.
🎯Cap Rate & Cash-on-Cash Benchmarks
| Band | Cap Rate | Cash-on-Cash | Typical Read |
|---|---|---|---|
| Low / premium market | 3% – 4% | Under 4% | Appreciation play, thin yield |
| Moderate | 5% – 6% | 4% – 7% | Balanced, common metro range |
| Solid | 7% – 8% | 8% – 11% | Healthy cash flow target |
| High / higher risk | 9% – 12% | 12%+ | Strong yield, check the risk |
📏The 1% and 2% Rule Reference
| Rule | Monthly Rent Target | On $250k Price | Meaning |
|---|---|---|---|
| 1% rule | 1.0% of price | $2,500 | Screening floor for cash flow |
| 0.8% soft pass | 0.8% of price | $2,000 | Common in pricier markets |
| 2% rule | 2.0% of price | $5,000 | Aggressive, rare in metros |
| 50% rule | Half of rent | Expenses est. | Rough operating cost check |
🗂Investment Scenario Grid
| Scenario | Price | Cash In | Rent/mo | Appr. | Profile |
|---|---|---|---|---|---|
| $250k SFR | $250k | $62k | $2,100 | 3.5% | Balanced starter rental |
| $400k Duplex | $400k | $98k | $3,600 | 3.0% | Two units, more cash flow |
| Cap Rate Focus | $180k | $185k | $1,850 | 2.0% | Yield over growth |
| High Appreciation | $550k | $135k | $3,200 | 6.0% | Growth-led metro |
| Cash Buyer | $220k | $232k | $1,950 | 3.0% | No loan, pure NOI |
| Value-Add | $210k | $88k | $2,250 | 4.0% | Rehab then re-rent |
⚙Full Formula Breakdown
📋Reference Values
| Input | Common Range | Where It Lands | Effect on ROI |
|---|---|---|---|
| Vacancy | 3% to 10% | Lowers effective rent | Cuts NOI, cap, cash flow |
| Operating expenses | 35% to 50% of rent | Subtracted from rent | Drives NOI and cap rate |
| Mortgage payment | P&I only | Below the NOI line | Sets cash flow and CoC |
| Principal paydown | 2% to 4% of loan | Adds to equity | Lifts total ROI, not cap |
| Appreciation | 2% to 6% yearly | Grows property value | Often the largest ROI piece |
💡Practical ROI Tips
Start from a number that seems reasonable to you. For instanse, it might be a place worth two-hundred-fifty-thousand dollars, so you want two thousand dollars per month. The math is tidy on paper.
Real estate isn’t always about recieveing or writing this monthly check, though. It’s about how these checks works together. They interact with property tax and debt while equity builds up quiet over time.
The Whole Picture of Real Estate Investing
Most people starting out focus on cash flow; it’s something they can feel. It’s money they can hold in their hands, but if you don’t pay attention to the other factors in action within a deal then holding onto money doesn’t mean you’re building wealth.
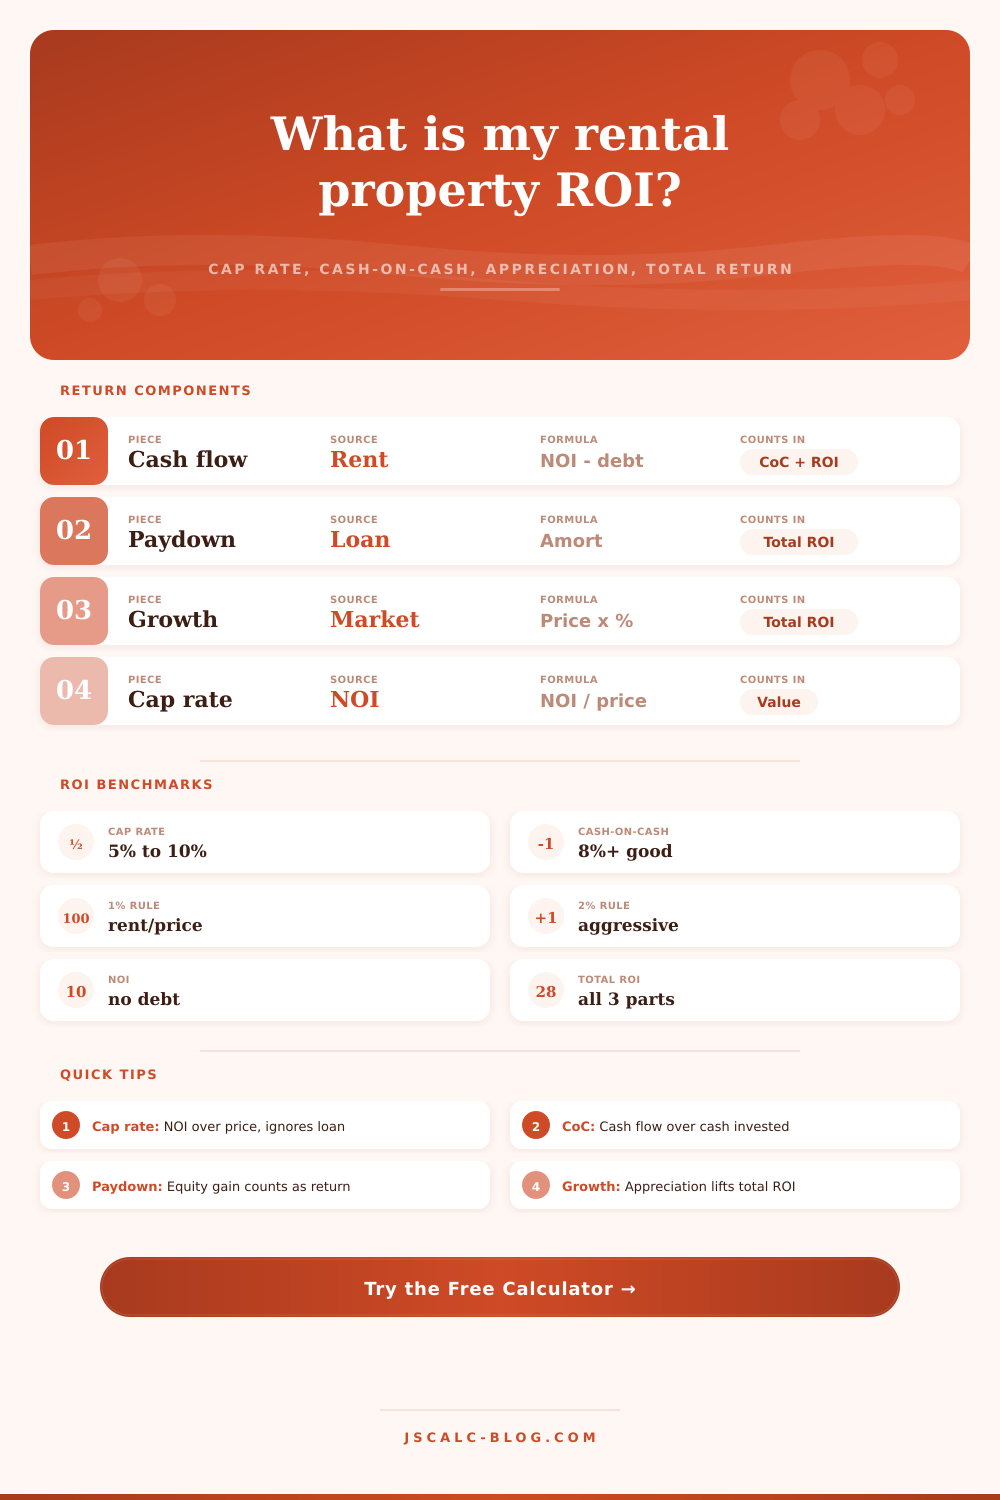
You can use the calculator up top to do this for yourself, but knowing what it’s measuring will change everything about a listing. The cap rate removes your financing from the equation and show you how property is performing on its own. Think of it as purity test for the property. Regardless of whether you financed the purchase or paid cash, if building has a high cap rate, that means it’s generating strong income relative to its price tag. In other words, it’s a metric that allow you to compare apples to apples across different markets. Before you ever speak with a lender, you’ll know precisely where the cash engine is stronger, such as six percent in one neighborhood and three percent in another.
But when we introduce your bank account into the room, we tell a different story: Cash-on-cash return. This is a measurement of how much of your actual investment go back to you in relation to how much you put down. This is where using borrowed money becomes a game-twister. Your cap rate may be modest, yet with just a 20% down payment, your cash-on-cash return look spectacular. This is why savvy investors don’t ignore either metric. They read both and know that one measure asset quality, while the other measures capital efficiency. Without reading both, you’ll be blind to half the picture.
And then there’s the silent wealth-building that doesn’t show up in your bank account. Every time you make a mortgage payment, some of your principal get paid down. If you’re paying 10 percent toward principal each month, 10 percent of your payment goes toward reducing your outstanding loan balance. Your equity go up, and your debt goes down… No matter how many repairs pile up on your house or how much your property taxes increases. It’s forced savings. You can love it or hate it, but it work for you.
And then there’s the appreciation. Over the long run, real estate tend to appreciate. Let’s say the market appreciates by four percent per year. Every single year, all of your real estate base appreciates by four percent. It is not just the slice you actualy own free-and-clear (a.k.a., “the slice I can sell”). These two… Principal paydown and appreciation, tend to account for most of your overall return on investment … but you won’t see them in a simple monthly budget spreadsheet. The page’s reference table explain everything by neatly dividing up these parts. As you’ll notice, the majority of your overall profit may not even come from cash flow. That portion is made up of both market appreciation (the value add) plus the equity gained from paying down the loan. Understanding this breakdown help you avoid the most frequent error of sacrificing long-term growth to get higher cash flow. A small profit each month could be offset by enormous appreciation over time. Keep an eye out for properties with huge upside potential, even if their monthly income is very low.
Also, you must factor in realistic operating expenses and vacancy rates. New investors think they’ll have 100% occupancy every month with zero repairs, but that optimism will kill your deal. If you trim five percent off your rent as “vacancy” and budget some cash for management, that’s your buffer for those inevitable broken furnace months and vacancies. Your conservative numbers will result in an ROI you know you’ll actualy get, not just something you hope to get.
At the end of the day, we don’t want something that only covers the mortgage. We’re building a portfolio of cash flow, appreciation, and equity that compounds over years. In this asset class, accuracy beats fast-flipping; patience always wins. Feed your numbers honest data, and the numbers won’t lie. Use those conservative assumptions as a starting point, tweak interest rate or downpayment amount to see how the grand total ROIs changes, and believe the whole picture more than any individual shiny metric.
You should of seen that the whole picture is what turns amateur hour into professional longevity by helping you stay in the game long enough to reap rewards from it.