Renovation Budget Calculator
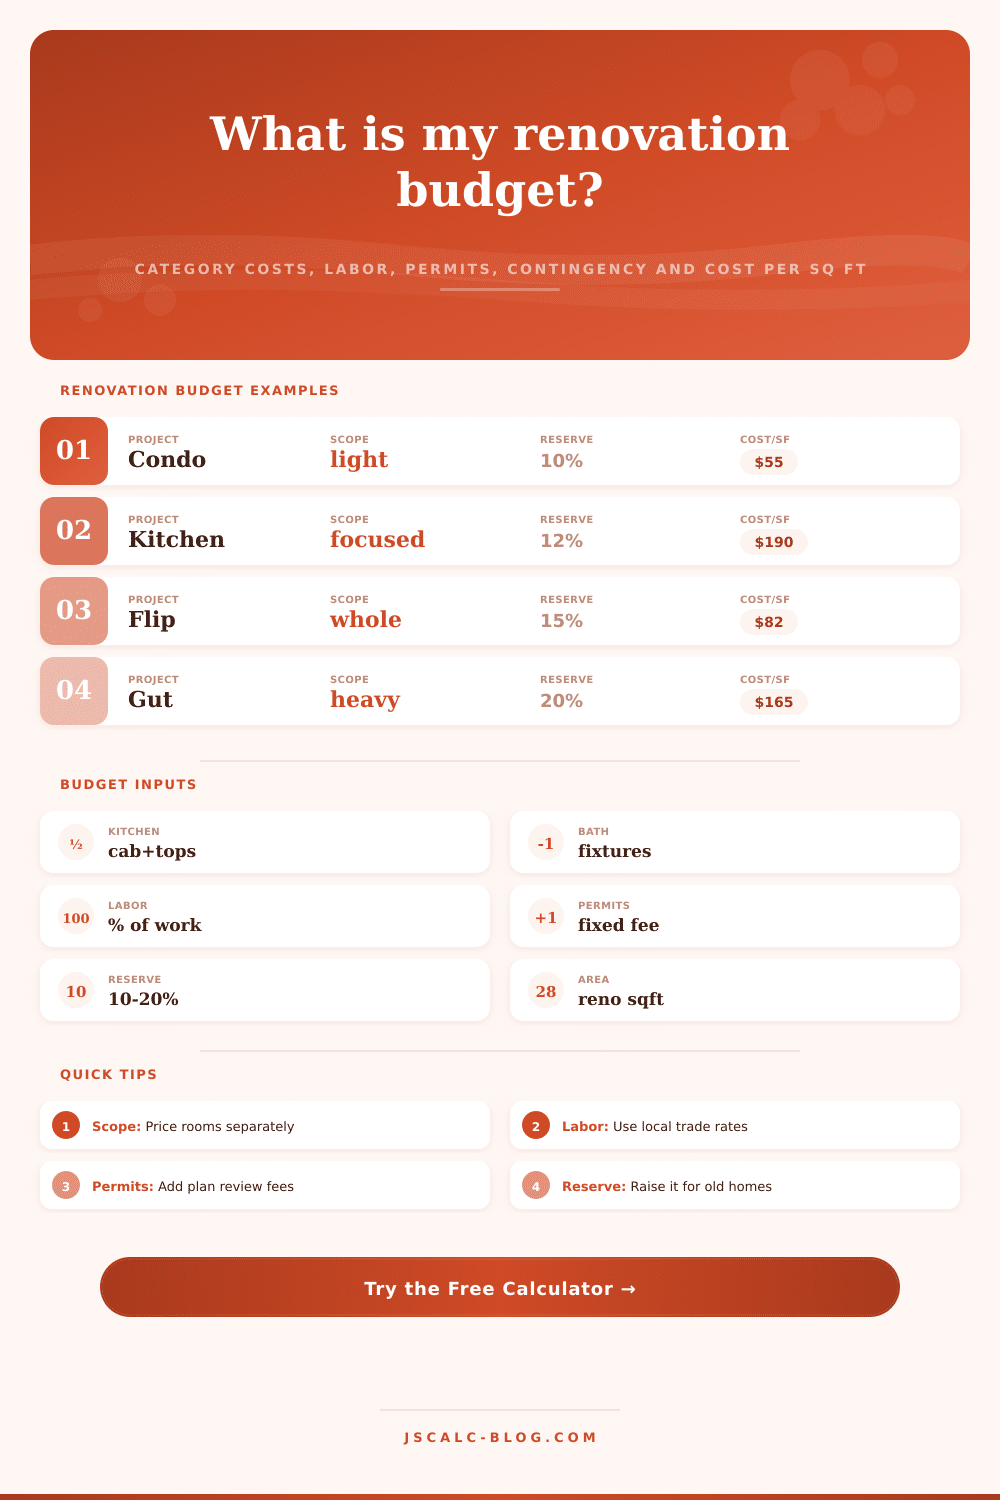
Total room and system allowances, add labor from a percentage, include permits, reserve contingency, and compare the full renovation budget per square foot.
These example rows are starting points for comparing scope mix, labor load, permit allowance, contingency and expected cost per renovated square foot.
| Project Type | Typical Area | Heavy Cost Buckets | Labor % | Permit Allowance | Contingency | Cost/SF Signal |
|---|---|---|---|---|---|---|
| Condo cosmetic refresh | 650-1,100 ft² | Paint, flooring, small bath | 22%-32% | $500-$2,500 | 8%-12% | Lower |
| Kitchen-focused remodel | 120-300 ft² | Kitchen, electrical, plumbing | 28%-40% | $800-$4,000 | 10%-15% | Higher |
| Bathroom pair | 80-180 ft² | Bath, plumbing, tile | 30%-45% | $700-$3,500 | 12%-18% | High |
| Rental turnover | 900-1,800 ft² | Paint, flooring, repairs | 20%-30% | $300-$1,500 | 8%-12% | Lower |
| Investor flip | 1,100-2,400 ft² | Kitchen, bath, surfaces, systems | 30%-42% | $1,500-$6,000 | 12%-18% | Medium |
| Systems overhaul | 1,200-2,800 ft² | Electrical, plumbing, HVAC | 32%-48% | $2,500-$8,000 | 15%-22% | Medium |
| Full gut remodel | 1,500-4,000 ft² | All categories | 35%-55% | $5,000-$18,000 | 18%-25% | High |
| Category | Entered Cost | Share Of Categories | Cost Per Renovated ft² | Budget Role |
|---|
| Preset | Renovated Area | Category Total | Labor % | Permits | Reserve % | Typical Use |
|---|
| Scope Condition | Typical Reserve | Why It Changes | Review Trigger | Calculator Action |
|---|---|---|---|---|
| Cosmetic work | 8%-12% | Mostly visible finishes | Few wall openings | Use lower reserve |
| Kitchen or bath work | 10%-18% | Fixtures and hidden lines | Moving drains or walls | Raise contingency |
| Old house systems | 15%-25% | Electrical, plumbing and HVAC risk | Knob, galvanized or duct changes | Use high reserve |
| Full gut remodel | 18%-30% | Many open assemblies | Structural or code findings | Stress test total |
That’s why the first step is creating a plan for your house that looks reasonable, until you try to estimate prices against it. That comes later when you sit down in front of a spreadsheet and realize you have no idea what lies behind walls of an old house. Renovation budget calculators are a tool to connect the world of aesthetics (what you want) and money (how much it will take). It’s more than tallying invoices; it’s also estimating the price tag of the unknown before taking out a single wall. The calculator do the math. What you make of it, however, depends on assumptions you plug into the start.
For bathrooms and kitchens, most people puts everything into one lump sum. It’s easy enough; then you forget about things like plumbing fixture replacement or moving electrical lines until they’re due, and you don’t have any money left over! By breaking down these costs, this calculator will help you visualize how you spend what you do. It asks for separate allowances for paint, floors, countertops, cabinetry and rough work (pipes, wiring).
How to Plan Your Renovation Budget
Why? The latter costs might be required by code or infrastructure, but the former is up to you. Does yours pre-date 1980? Your electrical allowance should double for an upgraded electrical panel. That’s right: there is a clear sign of this risk in the reference table on the page, which notes that older houses demands more reserves for invisible systems.
Intuition usually goes off the rails when it comes to Labor. Everyone underestimates how long it will take to demo or repair drywall and prep surface. Because some jobs require more labor relative to material costs, you can account for this by including your labor cost as a percentage of your systems and materials costs. Low-labor vs. High-labor: a cosmetic paint job is relatively less labor intensive compared to materials, whereas a full gut remodel is quite labor dependent.
To be clear, your “total” changes with this ratio, so that the final number represents actual work hours needed, not just the cost of goods. If you have over bought something (e.g., expensive tile), but then realize you can’t pay the tile installers’ hourly wage, this percent method avoid that mistake.
Less tangible expenses can creep up as well. Depending on where you live, permitting varies; no permit doesn’t mean free. Yes, you’ll get a thousand-dollar discount now but maybe twice that in fines/tear downs when an inspector discovers unpermitted work on something structural. By baking in a hard cost for inspections and permits, you’re acknowledging this overhead cost of your project. Boring? Sure. But it is real.
And then there are contingency funds. These aren’t savings accounts to dip into at will, they’re insurance against future unknowns (e.g., asbestos abatement, rotten subfloor). If it’s a light cosmetic refresh, ten percent may do. If you’re gut renovating an older home, twenty is a more reasonable cushion. With the tool, you can tweak this reserve based off how risky your project is and how old your home is.
Here’s what comes out: A total budget, and a cost-per-square-foot figure… Which you’ll want to compare to your region’s current market rate, but don’t let that be your primary yardstick. If your cost-per-square-foot is on the high side because of needed system improvements that will increase the lifespan of your house, great! Having a high cost-per-square-foot isn’t inherently negative.
Transparency is the key. You’re looking to understand where the bottom line comes from, down to the last dollar. If you can assign each dollar to its own category (contingency, materials, labor), you go from feeling like you’re making an uninformed guess to feeling like an empowered decision-maker. And that transparency is priceless… More valuable then any one line item in the bid. It’s the kind of breakdown that lets you see that your vision is now doable.
You should of checked this carefully. Actually, it’s moddern advice for any renovater.