Property Tax Increase Projection Calculator
Forecast your future property tax bill year by year under real assessment caps such as California Prop 13, Florida Save Our Homes, and the Texas 10% homestead cap. See tax now, tax at the end of your horizon, total paid, and the cumulative dollar and percent increase.
🏡Real Cap and Region Presets
📝Property and Tax Inputs
Taxable assessed value on this year's bill, not market price.
How fast the home's market value is expected to rise.
Caps limit how much taxable value can rise each year.
Used only when the cap rule above is set to Custom.
Choose mills or a percent; the value field adapts.
12 mills equals 1.2 percent, or $12 per $1,000 assessed.
Optional yearly rise in the levy set by local government.
Horizon to project, from 1 up to 40 years.
🔢Formula Snapshot
🗓Year by Year Projection
| Year | Assessed Value | Tax Rate | Annual Tax | Increase vs Prior | Cumulative Paid |
|---|---|---|---|---|---|
| Enter values and calculate to see the year-by-year grid. | |||||
📋Common Assessment Cap Rules
| Program | State | Annual Cap | Resets On |
|---|---|---|---|
| Proposition 13 | California | 2% or CPI | Sale or new build |
| Save Our Homes | Florida | 3% or CPI | Change of homestead |
| Homestead Cap | Texas | 10% | Improvement or sale |
| Proposal A | Michigan | 5% or CPI | Transfer of ownership |
| Measure 50 | Oregon | 3% | Major improvement |
| Rule B / Primary | Arizona | 5% | New construction |
| Assessment Cap | New York City | 6% yr / 20% 5yr | Class 1 homes |
💲Mills to Percent Reference
| Millage | Percent Rate | Per $100k Value | Per $400k Value |
|---|---|---|---|
| 5 mills | 0.5% | $500 | $2,000 |
| 10 mills | 1.0% | $1,000 | $4,000 |
| 12 mills | 1.2% | $1,200 | $4,800 |
| 15 mills | 1.5% | $1,500 | $6,000 |
| 20 mills | 2.0% | $2,000 | $8,000 |
| 25 mills | 2.5% | $2,500 | $10,000 |
🗄Cap Impact Comparison Grid
| Cap Rule | Cap %/yr | Tax Now | Tax Yr 10 | 10yr Total | Increase % |
|---|---|---|---|---|---|
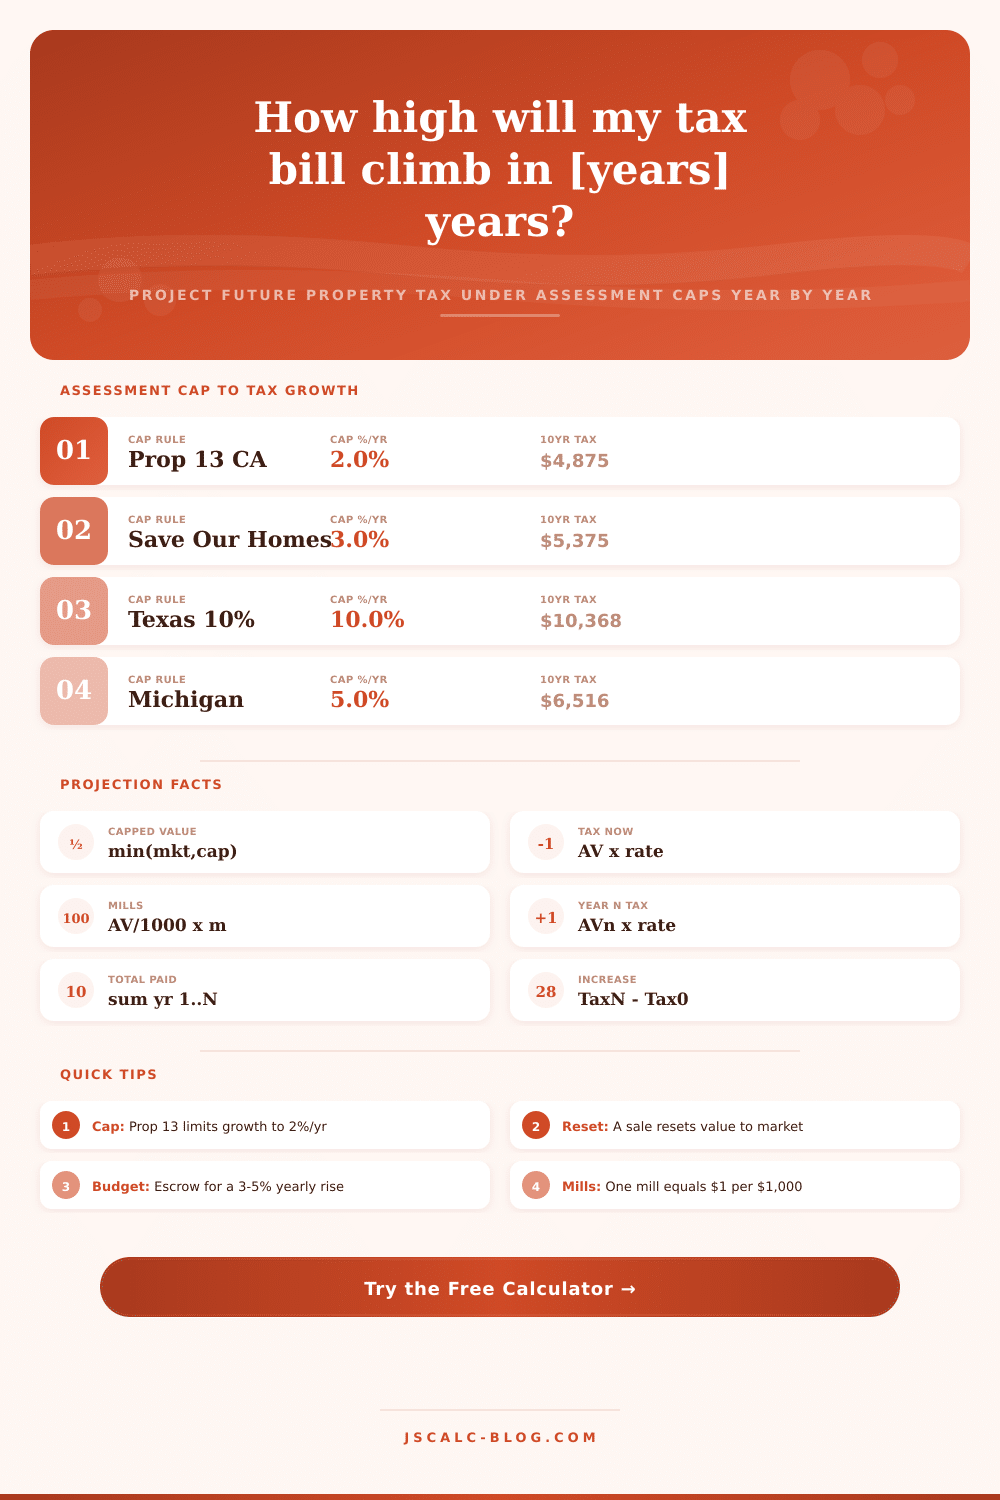
| Prop 13 CA | 2.0% | $4,800 | $5,851 | $52,626 | 21.9% |
| Save Our Homes | 3.0% | $4,800 | $6,450 | $54,974 | 34.4% |
| Oregon M50 | 3.0% | $4,800 | $6,450 | $54,974 | 34.4% |
| Michigan / AZ | 5.0% | $4,800 | $7,819 | $60,373 | 62.9% |
| Custom 7% | 7.0% | $4,800 | $9,441 | $66,306 | 96.7% |
| Texas 10% | 10.0% | $4,800 | $12,442 | $76,525 | 159.2% |
| No Cap (6% mkt) | 6.0% | $4,800 | $8,597 | $63,269 | 79.1% |
| Custom 1% | 1.0% | $4,800 | $5,302 | $50,467 | 10.5% |
⚙Formula Breakdown
💡Budgeting Tips for Rising Taxes
When you get an envelope in the mail from the county assessor, it typicaly lands with a thud, as if you’re reluctant to open it. It’s a prediction of your house’s price tag for the future. It is a forecast that gets hid behind increasing market prices and some mysterious local regulations.
Homeowners mostly glance at amount listed on their tax statement today and take it for granted that next year won’t be all that different. It’s a risky assumption. Property taxes is one of the biggest bills we pay. But we don’t project these expenses like we do our mortgage payment or estimate for utilities. To understand what your bill will become, you need to step outside this years number and look into future. That’s what the calculator above does: It models your growth based off certain assessment caps.
How to Predict Your Future Property Taxes
Your tax bill goes up for two reasons. First, your house gets appraised at higher and higher values, which usually matches how much the market grow. Second, your tax rate also increases. This rate is typically stated as “x mills,” which mean x dollars per $1,000 of value. If either of these factors grows, so does your bill.
A relatively small 3-5% annual increase for a decade will push that initially-reasonable sum up by a third or more. This isn’t simply inflation, this is compound value bumping into compounded rates. And that’s what folks miss when they plan for last years check.
To lessen this impact, many states impose assessment caps, capping the maximum rate of increase on your taxable value from one year to the next (even if market is going crazy). Under California’s Proposition 13, it’s limited to two percent per year. In Florida, thanks to its Save Our Homes provision, it’s a three percent cap. For homesteaded properties in Texas, it’s up to ten percent. In Arizona and Michigan, it’s around five percent.
The calculator accounts for this phenomenon; every year, we’ll assume your taxable value increases by the lesser of (1) the percentage at which you think the market will appreciate, and (2) your state’s cap. Even if the market rockets while your cap remains flat, your taxable value will only rise by amount allowed in your capped jurisdiction. This provides a cushion between your bill and your neighbor’s if they lives in an uncapped jurisdiction.
This one is pretty straightforward, and its power lies in understanding amount of time. You put in your assessment number and the tool will move forward by one year. It then adjusts the assessed value and applies existing tax rate to calculate the bill for that year. You can also optionally include millage growth. Local government may well raises millage rates, even as the assessed value increases. That is a double whammy. Your actual cost over two decades can get wildly off track if you only use a simple linear calculation. The cumulative increase number shows you how shocking those little annual changes are when they add up over time.
This is not meant to be a gotcha post. It’s simply knowing how far up that curve goes, that way what could of been a nasty surprise becomes something you can easily plan for. Say a three-percent cap causes your bill to climb from $4,800 a year to about $6,450 during the next decade. You’ll know it’s time to save a little more each month to cover difference. If you pay taxes on your own, you may stash away the difference into a special account, instead of getting blindsided by a reassessment letter midyear when your wallet starts hurting. Because the difference between a 10 percent cap vs. A 2 percent cap can mean a difference of tens of thousands of dollars for a relatively inexpensive house over just a few years.
Remember: Assessment caps shield the sitting homeowner; they don’t shield the house forever. A major improvement (or sale) reset the assessed value to match current market price in all but the few capped states. So the reset effect is this: The year following a sale, a long-time-owner’s property may see a doubling or tripling of its tax bill. When you buy, estimate the post-sale bill based on today’s market value, not the artificially low rate the seller currently pays. You’ll otherwise grossly under-estimate how much it costs to own furnitures.
The tool only asks for a handful of things in order to create a vivid image. First, choose a preset based on your state. Or, plug in your own parameters, such as market growth expectations, assessed value at present, and local tax rate. Then, it spits out annualized values as well as cumulative values over time, offering you a more accurate sense of what your tax bills will look like.
If you’re thinking about downsizing, upsizing, becoming a first-time homebuyer or just retiring, this gives you a real look at what that future will cost (no guessing required). It makes the invisible hand of government a real financial burden, one that you can plan for instead of against.