Property Rental ROI Calculator
Model a financed rental the way real investors do. Enter purchase price, down payment, mortgage rate and term, closing and rehab costs, rent, operating expenses, and appreciation to get cash-on-cash return, monthly cash flow, total cash invested, and a first-year total ROI that includes loan paydown and appreciation, plus a multi-year equity projection.
🏠Real Deal Presets
📝Deal Inputs
All-in contract price of the property.
Equity you put in; the rest is financed.
Annual nominal rate on the loan.
Amortization length, usually 15 or 30.
Upfront cash beyond the down payment.
Gross scheduled rent collected per month.
Taxes, insurance, repairs, vacancy, mgmt - not the mortgage.
Expected yearly rise in property value.
Years shown in the equity and return table.
Yearly increase applied to rent and expenses in the projection.
| Year | Cash Flow | Equity | Cumulative Return | Total ROI |
|---|
📊ROI Formula Snapshot
💵Cash-on-Cash Return Bands
| Cash-on-Cash | Rating | What It Signals | Typical Deal |
|---|---|---|---|
| Below 0% | Negative | Property loses cash monthly | Low down, high rate |
| 0% to 4% | Thin | Barely covers itself | Appreciation play |
| 4% to 6% | Modest | Beats a savings account | Coastal metro rental |
| 6% to 8% | Solid | Healthy leveraged return | Balanced market |
| 8% to 12% | Strong | Cash-flow investor target | Midwest single-family |
| 12% to 15% | Excellent | Rare, verify assumptions | Value-add or BRRRR |
| Above 15% | Check twice | Often understated expenses | Small multifamily |
🧩Components of Total Return
| Component | Source | How It Is Earned | Cash or Paper |
|---|---|---|---|
| Cash flow | Rent minus costs | Rent less op ex and mortgage | Cash in pocket |
| Principal paydown | Tenant pays loan | Loan balance drops each month | Equity, not cash |
| Appreciation | Market value rise | Property value grows over time | Paper until sale |
| Tax shelter | Depreciation | Non-cash deduction vs income | Deferred benefit |
| Forced equity | Rehab and add value | Improvements raise value fast | Equity, not cash |
📏The 1% and 50% Screening Rules
| Rule | Formula | Example | Meaning |
|---|---|---|---|
| 1% rule | Rent ≥ 1% of price | $250k needs $2,500 rent | Fast cash-flow screen |
| 2% rule | Rent ≥ 2% of price | $100k needs $2,000 rent | Aggressive, rare markets |
| 50% rule | Op ex ≈ 50% of rent | $2,100 rent, $1,050 op ex | Quick expense estimate |
| 70% rule | Buy ≤ 70% ARV minus rehab | $200k ARV, $30k rehab, $110k | Flip and BRRRR cap |
| DSCR | NOI / debt service | $18k NOI / $15k = 1.2 | Lender coverage ratio |
⚖Leverage Effect: Down Payment vs Returns
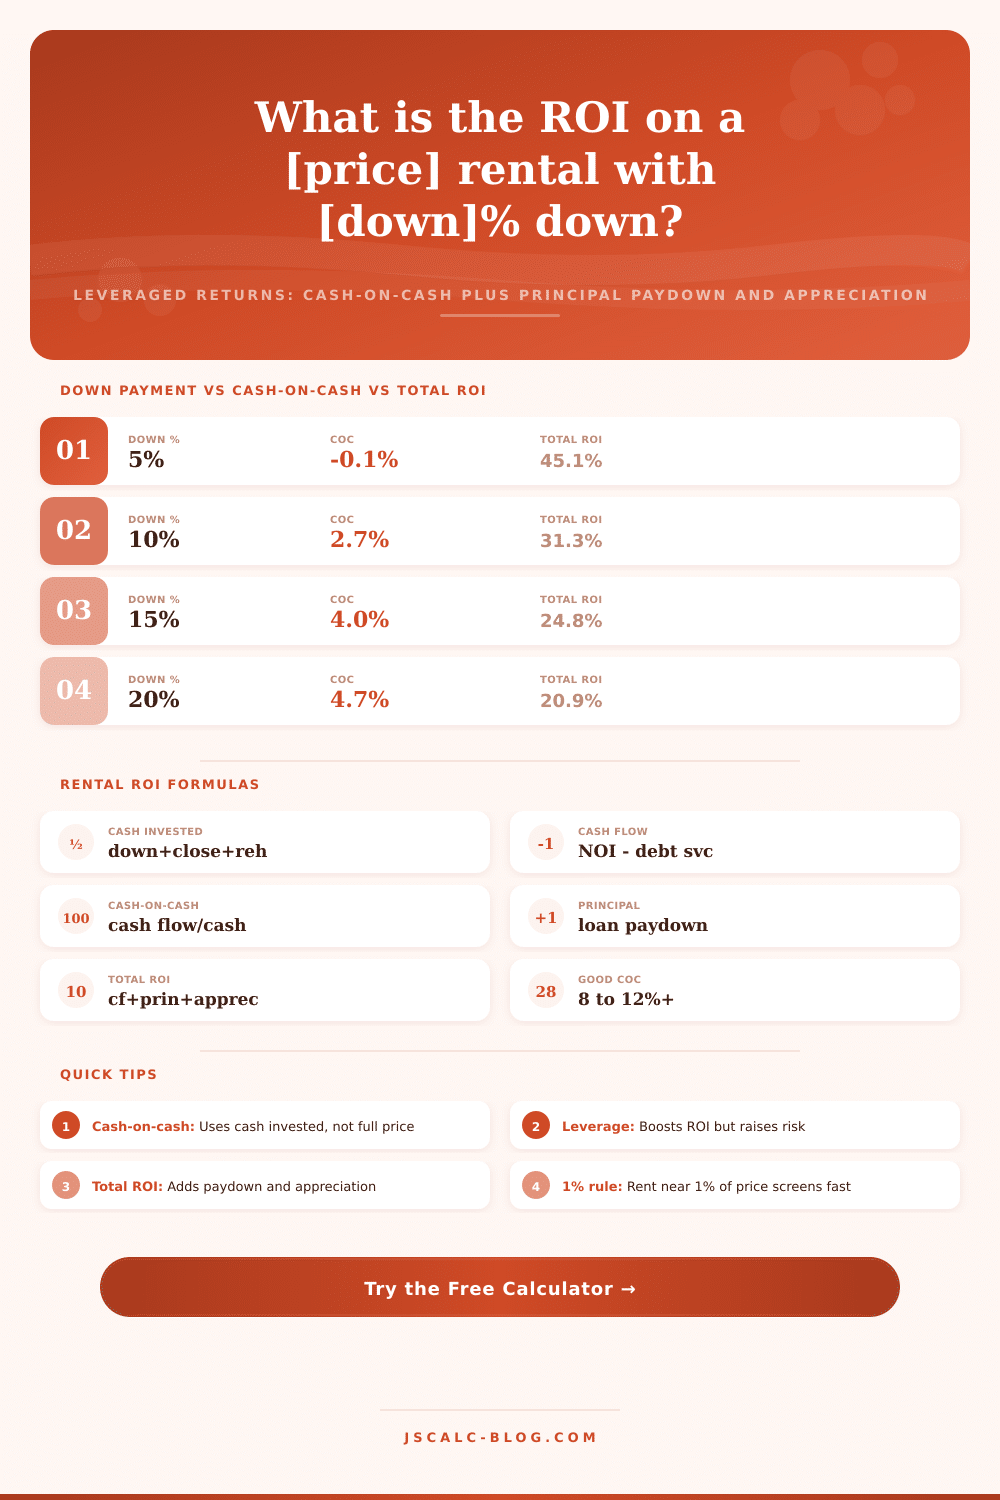
| Down Payment | Down $ | Cash Invested | Cash Flow / Mo | Cash-on-Cash | Total ROI |
|---|---|---|---|---|---|
| 5% | $12,500 | $22,500 | -$1 | -0.1% | 45.1% |
| 10% | $25,000 | $35,000 | $78 | 2.7% | 31.3% |
| 15% | $37,500 | $47,500 | $157 | 4.0% | 24.8% |
| 20% | $50,000 | $60,000 | $236 | 4.7% | 20.9% |
| 25% | $62,500 | $72,500 | $315 | 5.2% | 18.4% |
| 30% | $75,000 | $85,000 | $394 | 5.6% | 16.7% |
| 40% | $100,000 | $110,000 | $552 | 6.0% | 14.4% |
| 50% | $125,000 | $135,000 | $710 | 6.3% | 12.9% |
| All cash | $250,000 | $260,000 | $1,500 | 6.9% | 9.8% |
⚙Formula Breakdown
💡Investor Tips
Gross yield is where most rental calculators end. Gross Yield is simply rent divided by price; it’s an okay looking number on paper but it excludes financing. Gross Yield is fine if you’re sketching out a deal. But when it comes time to put some of your hard-earned cash down? Not so much.
The Property Rental ROI Calculator on this page was designed for deals with loans. It inputs your purchase price, down payment, mortgage term & rate, closing + rehab costs, rent, operating expenses, and expected appreciation; then reports what realy matters. It reports your cash-on-cash return, month-over-month cash flow, total cash invested, and a first-year total ROI that factors in both the value growth and loan paydown you’ll actualy capture as an owner.
Why Gross Yield Is Not Enough for Your Investment
When you buy a mortgaged rental, you have a large asset secured for you with a small slice of your own money. For instance, if you buy a $250,000 house with 20% down, that means you’ve tied up just $50,000 in equity. Yet you receive 100% of the appreciation, the loan paydown, and the rent on the entire value. This mismatch is why the returns on real estate are so unlike any simple yield.
A basic gross yield calculator assumes that you’re investing your entire purchase price. However, an ROI calculator using debt take into account that you only invested a fraction of that amount (your cash). The difference isn’t cosmetic. Your total ROI may approach double digits. Your cash-on-cash return may be higher. However, your gross yield may read 4% on that exact same property.
The number used for every return calculation in this tool is tied to a single source of truth: The cash you spent to buy the deal itself. It is not the loan amount. It is not the purchase price. It is the down payment plus closing costs plus any rehab. So if you drop $50,000 into the bank and shell out $10,000 toward closing and light rehab, then you’ve spent $60,000 in cash. This figure is important because it’s the basis for both your total ROI and cash-on-cash return. Those investors who neglect to account for rehab and closing will overestimate how hard their money is working. People who divide by the total price instead of the actual cash invested will underestimate there return.
Monthly principal and interest, this is where the deal lives or dies. It’s all about cash flow. The calculator takes that cost from standard amortization formula. At 6.5%, your $200,000 loan over 30 years will cost approximately $1,264 per month.
Rent minus operating expenses equals net operating income (NOI). Annual cash flow equals that NOI minus yearly debt service. See how operating expenses don’t include the mortgage? Management, vacancy, repairs, insurance, and taxes are part of operating expenses. The loan is treated separately as debt service so you can easily see coverage.
For income investors, the headline metric is cash-on-cash return, meaning how many dollars of annual pre-tax cash flow are generated per dollar of total cash invested? For example, if your property throws off $2,830 per year in cash flow on an investment of $60,000, that’s about 4.7% cash-on-cash return. This metric deliberately excludes loan paydown and appreciation because it answers one clear question: How much spendable cash do my dollars currently generate? In markets with high growth (where appreciation drives the return), seasoned buyers will take less; in cash-flow markets, they’ll shoot for 8% or more. The reference tables within the calculator outline those bands so you can tell at a glance whether any given deal falls into the “too good to be true,” “solid” or “thin” bucket.
Cash flow is only one of four ways a rental pays you. The calculator captures the three other ways a rental pays you, including the two types of equity growth that a yield number misses. One type is principal paydown: the share of every mortgage payment that goes toward lowering your loan balance. Think of it as if your tenant were buying you the building a bit at a time. The other type is appreciation, or how much the building’s market value increases.
To calculate total first-year ROI, add up the cash flow, the first-year principal paydown, and the first-year appreciation. Then, divide that sum by the amount you invest. Although the cash-on-cash part is moderate, on our base example it all stacks into a solid total return. One year is deceptive, though, that’s why the tool extrapolates your hold period forward to however many years you’d like to project. It will grow your expenses and rent by whatever rent-growth rate you assume each year; it will appreciate the property value; it will reduce principal on the mortgage, which reduces your loan balance; and it’ll add up the running total return for you. The resulting table lets you see your cumulative return, your equity position, annual cash flow and the total ROI to date. You get to watch the loan shrink while your equity rises, and the compounding power of leveraged real estate becomes tangible. A modest cash flow in the beginning gets dwarfed by equity growth over a decade.
With a click, you get 10 preset scenarios that apply to real-world situations. How would all cash vs. 20 percent down affect a luxurius rental? What about a Midwest single family with solid cash flow? Compare apples-to-oranges and see for yourself. The best part is the leverage table, which illustrates what happens if you hold one property fixed and vary the downpayment from 5 percent to all cash. Cash-on-cash margin increases modestly; total return drops sharply. That’s the counter-intuitive takeaway of leveraged investing: More leverage amplifies your equity return, yet it also narrows your cash-flow buffer and increases the risk of a shortfall.
Before writing an offer, run every deal through the calculator. Use a preset and plug in your property’s numbers. Then, read all four cards back-to-back instead of separately. Is this a steady income holding (strong cash flow, modest total ROI)? Is it an appreciation bet (weak cash-on-cash, strong total ROI)? A steady income holding needs reserves; an appreciation bet requires reserves.
This tool ties each metric to actual money invested, separates the mortgage from operating expenses, and gives you an honest, leveraged view of everything, something a basic yield calculator never could. It helps you size your down payment, stress-test the cash flow, and make purchase with confidence. That napkin sketch? That is just the start.