Marketing ROI Calculator
Measure digital campaign return with marketing ROI = (revenue minus ad cost) divided by ad cost, then read ROAS as revenue divided by spend, margin-adjusted profit, customer acquisition cost, break-even ROAS, cost per lead or click, and your conversion rate in one place.
📈Revenue Input Mode
🎯Real Campaign Presets
📝Campaign Inputs
Total money paid to run the campaign.
Sales attributed to this campaign.
Number of orders the campaign drove.
Revenue = conversions × this AOV.
Share of revenue left after cost of goods.
New buyers, used for CAC = spend / buyers.
Sign-ups or enquiries, for cost per lead.
Ad clicks, used for cost per click.
Ad views, used for CTR and CPM.
Controls rounding on the result cards.
🔢Formula Snapshot
📊ROAS Quality Bands
| ROAS | As Percent | Read As | Typical Verdict |
|---|---|---|---|
| Below 1x | < 100% | Under water | Revenue below spend, losing money |
| 1x to 2x | 100% to 200% | Thin | Often unprofitable after margin |
| 2x to 3x | 200% to 300% | Fair | Works at healthy gross margins |
| 3x to 4x | 300% to 400% | Solid | Common ecommerce comfort zone |
| 4x to 6x | 400% to 600% | Strong | Clear profit, room to scale spend |
| 6x to 10x | 600% to 1000% | Excellent | High efficiency, push budget up |
| Above 10x | > 1000% | Outstanding | Rare, may be under-spending reach |
💰Benchmark CAC by Channel
| Channel | Typical CAC Range | Best For | Note |
|---|---|---|---|
| Google Search | $30 - $150 | High intent buyers | Cost rises with competition |
| Meta (FB / IG) | $20 - $120 | Broad ecommerce | Creative drives efficiency |
| TikTok Ads | $15 - $90 | Younger audiences | Low CPM, variable quality |
| LinkedIn Ads | $100 - $400 | B2B and SaaS | High CAC, high deal value |
| YouTube Ads | $25 - $130 | Awareness to sale | Great for demos and reach |
| Email / CRM | $5 - $40 | Repeat buyers | Owned channel, low cost |
| Affiliate / Referral | $20 - $110 | Trusted intros | Pay on performance |
⚖Gross Margin to Break-Even ROAS
| Gross Margin | Break-Even ROAS = 1 / Margin | Revenue per $1 to Break Even | Comfort Target ROAS |
|---|---|---|---|
| 20% | 5.00x | $5.00 | 7x or higher |
| 30% | 3.33x | $3.33 | 5x or higher |
| 40% | 2.50x | $2.50 | 4x or higher |
| 50% | 2.00x | $2.00 | 3x or higher |
| 60% | 1.67x | $1.67 | 2.5x or higher |
| 70% | 1.43x | $1.43 | 2x or higher |
| 80% | 1.25x | $1.25 | 2x or higher |
| 90% | 1.11x | $1.11 | 1.5x or higher |
📏ROI vs ROAS Relationship
| ROAS | Marketing ROI | Meaning | Rule |
|---|---|---|---|
| 0.5x | -50% | Half of spend returned | ROI = ROAS - 1 |
| 1.0x | 0% | Revenue equals cost | Gross break-even |
| 1.5x | 50% | $1.50 back per $1 | ROI = ROAS - 1 |
| 2.0x | 100% | Doubled the spend | ROI = ROAS - 1 |
| 3.0x | 200% | Tripled the spend | ROI = ROAS - 1 |
| 4.0x | 300% | 4x return on ads | ROI = ROAS - 1 |
| 5.0x | 400% | 5x return on ads | ROI = ROAS - 1 |
🗃Spend vs Revenue Comparison Grid
| Ad Spend | Revenue | ROAS | Marketing ROI | Profit at 60% Margin | Verdict |
|---|---|---|---|---|---|
| $1,000 | $2,000 | 2.00x | 100% | $200 | Break-even-ish |
| $1,000 | $3,000 | 3.00x | 200% | $800 | Profitable |
| $2,000 | $8,000 | 4.00x | 300% | $2,800 | Strong |
| $5,000 | $25,000 | 5.00x | 400% | $10,000 | Excellent |
| $3,000 | $6,000 | 2.00x | 100% | $600 | Break-even-ish |
| $4,000 | $4,000 | 1.00x | 0% | -$1,600 | Losing |
| $2,000 | $1,600 | 0.80x | -20% | -$1,040 | Under water |
| $10,000 | $50,000 | 5.00x | 400% | $20,000 | Excellent |
| $1,500 | $6,000 | 4.00x | 300% | $2,100 | Strong |
| $2,500 | $5,000 | 2.00x | 100% | $500 | Break-even-ish |
⚙Formula Breakdown
💡Practical ROI Tips
In digital marketing, you get used to staring at a color chart-filled dashboard that doesn’t make sense. Are you making money? Or not? When you see traffic increasing and ad spend going up, how do you know for sure if you’re profitable or not? The calculator above does the math for you when you enter your sales and spend numbers. That way you won’t be left wondering if this campaign is working, or if it’s simply efficient at burning cash.
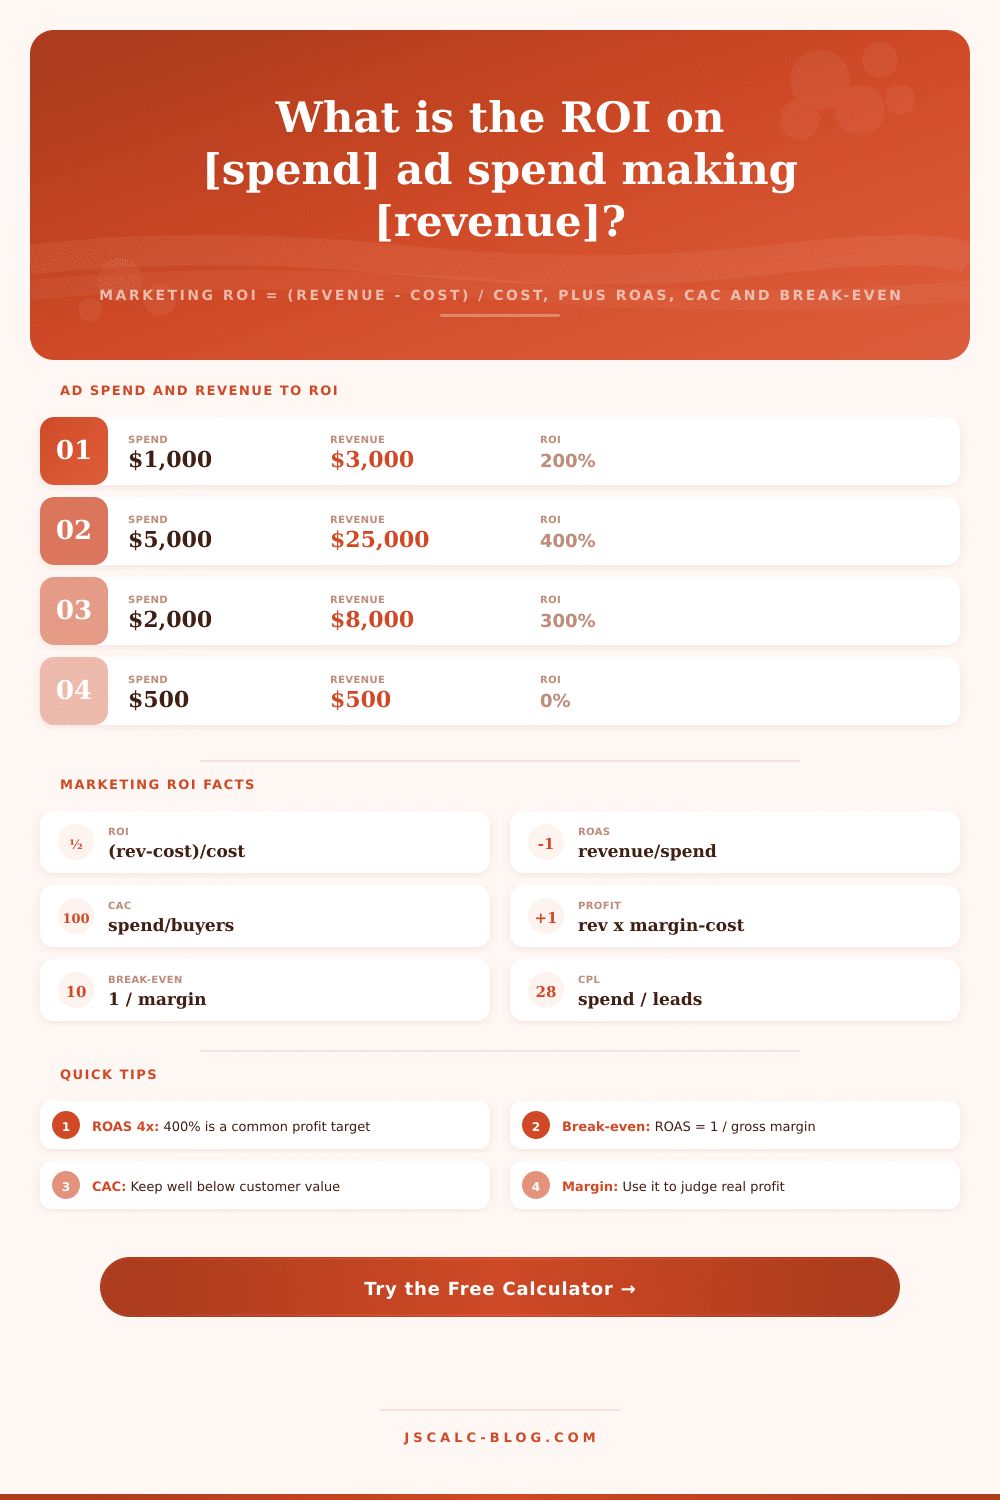
But what about marketing ROI? Marketing ROI answer the simple question of “How many dollars of net return did I get back per dollar that I placed in this campaign?” It is calculated by taking revenue minus cost and dividing it by cost. If you run a campaign that brings in twenty-five thousand in sales but only costs five thousand dollars in ads, then you have an ROI of four hundred percent. You got four dollars of pure gain for every one dollar you invested in the campaign. At gross break-even, the ROI is zero percent because revenue equals cost. Losing money before factoring in product costs gets you a negative number.
How to Calculate Marketing Profit
The problem is that the metric everyone shows you out-of-the-box (because they look pretty) is return on ad spend, or ROAS. Which is just spend over revenue. So that 25 grand in sales turns into five-point-zero ROAS. The problem is: What exactly are we looking at? If your cost is just ad spend, then ROAS -1 = ROI. Four hundred percent ROI for a five-point-zero ROAS.
ROAS and ROI are two sides of the same coin, but ROAS doesn’t include cost of goods sold. Fold in your product margin and you might have a perfectly healthy looking ROAS and still be losing money. Which is why most people mess this up. Enter your gross margin as a percentage here. The tool calculates margin-adjusted profit, i.e. This is actual money in the bank.
Revenue times margin equals gross profit. Subtract ad spend from that to get net profit. If your margin is sixty percent, then 25k in revenue gets you 15k in gross profit. Spend five thousand. Keep ten thousand. Different margins for two ads with the same ROAS? That could mean wildly different amounts of actual dollars in your bank account.
Don’t judge by revenue. Every campaign has a minimum ROAS, and if it falls below that level, the campaign loses money. This depends solely on your margin. Gross break-even equals one divided by gross margin. If your gross margin is 50%, then you need a break even ROAS of two-point-zero. If your gross margin is 25% then you need to reach a full four-point-zero, otherwise the campaign doesn’t contribute a single cent of profit. It’s laid out in the reference table on the page. One-point-zero ROAS will never be enough to beat gross break-even. To stay alive you should of beat the margin-based break-even.
But revenue isn’t everything; so is how efficiently you acquire that revenue. CAC (customer acquisition cost) is defined as amount spent on ads, divided by number of customers acquired. For example, if you spend five thousand dollars acquiring two hundred customers, then your CAC is twenty-five dollars per customer. The tool further breaks down spend into cost per click, and cost per lead. That lets you compare the cost of different channels, and identify areas in the funnel where it’s leaking. If you have a low cost per click but high CAC, typically it means there’s a conversion issue on landing page instead of the ad itself.
Conversion rate = Customers / Clicks. Five thousand clicks and two hundred buyers equals a four percent conversion rate. It’s tiny changes that affect ROI and CAC directly. If you double your conversion rate, for example, then you basically half your cost per customer acquisition, while maintaining same spend. When viewing CTR, CR, CAC, and ROI simultaneously, it becomes clear what needs fixing: your landing page? Your targeting? Your creative?
Enter revenue straight through. Or, if you know your number of orders but not your revenue, switch to the option that multiplies conversions by average order value. A hundred-twenty dollar average order value multiplied by forty sales equals forty-eight hundred dollars in revenue, all auto-calculated for you. Realistic scenarios are preloaded as preset buttons that load with one click. Presets range from a losing, zero-point-eight ROAS campaign to a ten-thousand dollar scaled push. Each preset populates the fields and calculates automatically. This lets you play around with the numbers without having to type them in.
If you run social ads or paid search, this calculator will provide a reliable answer within seconds. It eliminates vanity metrics. It tells you precisely which campaigns are draining your wallet and which campaigns is paying you back. Now take those numbers back to the same dashboard. I think you’ll find it’s much easier to spot the ghost of profit.