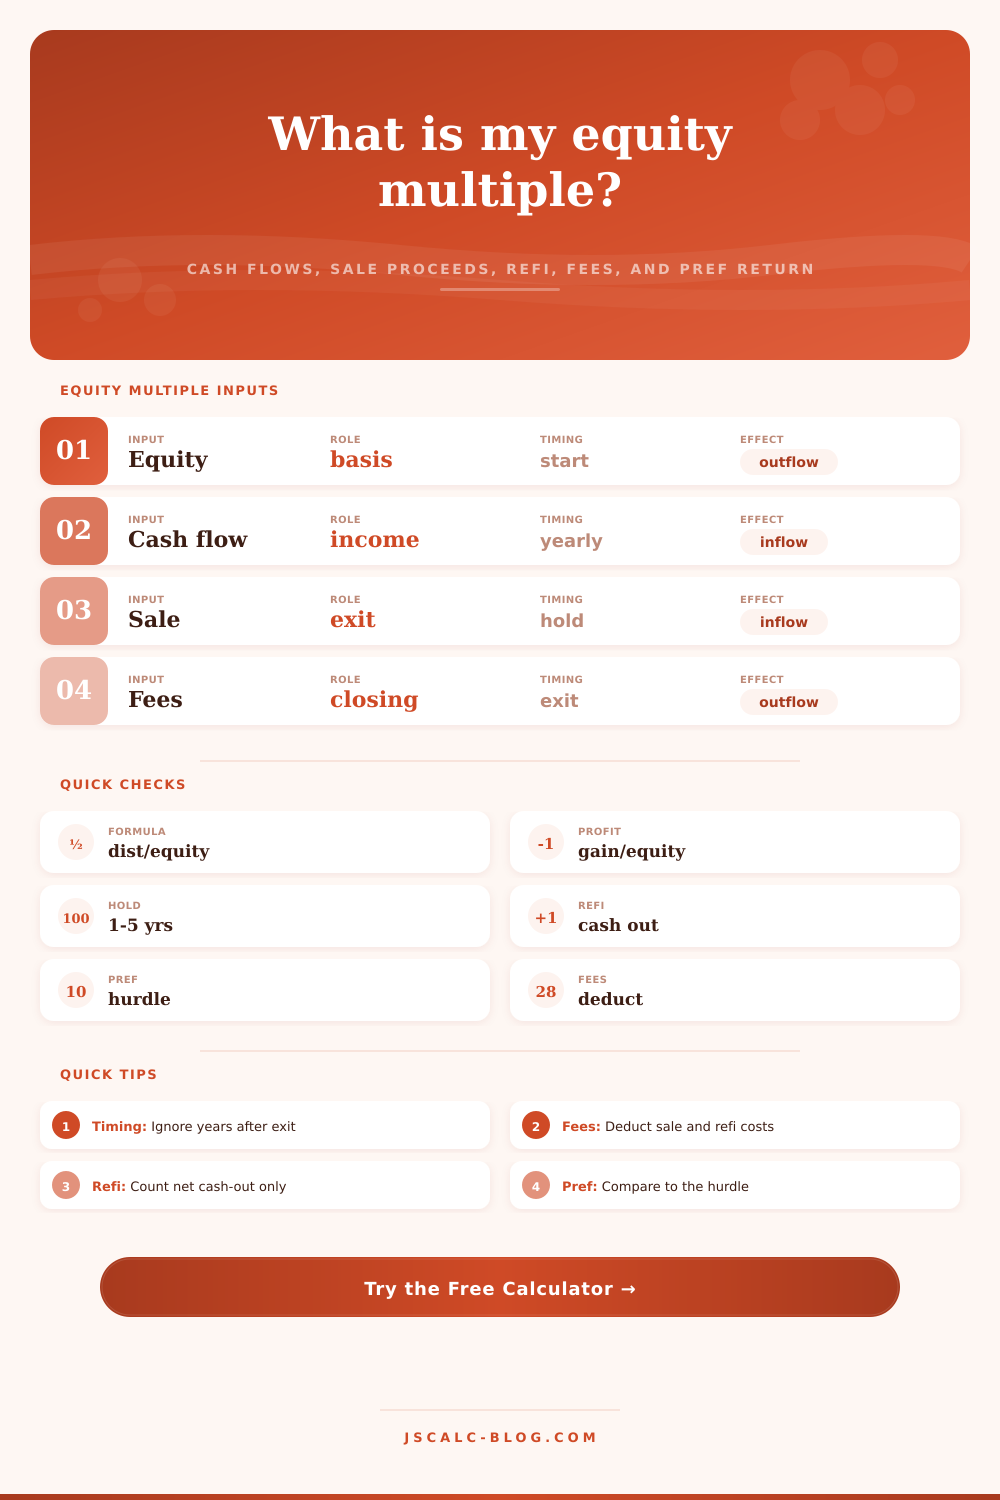
Property Equity Multiple Calculator
Measure total cash returned against equity invested, including annual cash flows, sale proceeds, refinance proceeds, fees, hold timing, reinvestment, and preferred return context.
The schedule includes only years inside the selected hold period. Refinance proceeds are shown in the chosen refinance year for timing context.
| Year | Cash flow | Refi proceeds | Sale proceeds | Fees | Net distribution |
|---|---|---|---|---|---|
| 1 | $18,000 | $0 | $0 | $0 | $18,000 |
| 2 | $21,000 | $0 | $0 | $0 | $21,000 |
| 3 | $24,000 | $0 | $0 | $0 | $24,000 |
| 4 | $26,000 | $0 | $0 | $0 | $26,000 |
| 5 | $29,000 | $0 | $405,000 | $18,000 | $416,000 |
| Multiple range | Capital result | Profit multiple | Read with | Common review |
|---|---|---|---|---|
| Below 1.00x | Capital loss | Negative | IRR and downside | Why equity was impaired |
| 1.00x to 1.25x | Capital returned | 0.00x to 0.25x | Hold length | Whether time justified risk |
| 1.25x to 1.75x | Moderate gain | 0.25x to 0.75x | Cash yield | Reliability of income stream |
| 1.75x to 2.25x | Strong gain | 0.75x to 1.25x | Exit assumptions | Sale price and fee sensitivity |
| Above 2.25x | High gain | Above 1.25x | Risk profile | Whether upside is repeatable |
| Scenario | Equity | Hold | Cash flows | Exit proceeds | Fees | Equity multiple |
|---|---|---|---|---|---|---|
| Steady duplex | $180,000 | 5 yrs | $104,000 | $310,000 | $14,000 | 2.22x |
| Small value-add | $325,000 | 4 yrs | $138,000 | $610,000 | $42,000 | 2.17x |
| Cash-out refi | $420,000 | 5 yrs | $172,000 | $500,000 | $38,000 | 2.51x |
| Five-year hold | $250,000 | 5 yrs | $118,000 | $405,000 | $18,000 | 2.02x |
| Step | Formula | Includes | Excludes | Use |
|---|---|---|---|---|
| Cash flow sum | Y1 + Y2 + ... | Held years only | Years after exit | Operating distributions |
| Total distributions | CF + sale + refi - fees | Net cash returned | Unpaid paper value | Equity multiple numerator |
| Equity multiple | Distributions / equity | Capital returned plus profit | Time value | MoIC-style return |
| Profit multiple | (Distributions - equity) / equity | Gain only | Original capital | Profit on invested equity |
| Preferred return | Equity x pref x years | Simple hurdle check | Waterfall complexity | Benchmark comparison |
When you sell a property after holding it long enough to get your initial cash investment back, you breathe a sigh of relief. You’ve outsmarted inflation! That’s actualy what people get wrong. Getting your money back is just the baseline for breaking even. But merely recouping your funds, in nominal dollars; are simply break-even. To determine if you made an investment decision, or simply protected yourself from time’s passage, look at the equity multiple. This eliminates all distraction of leverage ratios and interest rates. It measures the pure ratio between what went in versus what came out. The multiple will be 1x if you didn’t gain or lose anything, meaning you’ll end up with your exact original dollars.
Investors begin by considering cash-on-cash yield (no problem). That help them know their liquidity on a monthly basis. However, that fails to capture the full story of total return. Renting an apartment could generate eight percent annual cash-on-cash yield. Yet building loses 10% of its value annually. You’re receiving payments to lose money.
Why Equity Multiple Is Better Than Cash Yield
When you enter the exit proceeds and distributions into calculator, it spits out math for you. It prevents you from having to mentally piece together years’ worth of random cash flows. Instead, it forces you to think about the full cycle of each investment as a whole. Thinking about the whole picture are essential when designing a portfolio.
Start with what’s yours: Enter your starting equity. That doesn’t mean down payment alone. It means all money out-of-pocket at the start, including closing costs, renovation budgets, and other early costs. Underestimate this denominator and everything else in spreadsheet becomes false. Next, chart the cash flows. Rent won’t stay constant (most people think it will). In fact, there is always periods where it grows very well. This is followed by other periods when it stays the same or declines, such as when leases roll over or maintenance bills spike. You can enter year-by-year into tool. Why? Because real life isn’t a smooth curve; it’s a jagged line.
Most deals are won or lost at exit strategy. How much do you think you’ll get when you sell? Even more crucially, how many fee do you expect to pay? Fifteen percent of the gross sales price may be eaten up by brokerage commissions, legal fees and transfer taxes. Forget about those friction costs and it’s easy to believe your projected multiple looks far rosier then it really does. By subtracting them from top number before dividing by your equity, the calculator presents you with a true sense of what you’ll see land in your bank account. That clarity is essential when comparing two seemingly similar opportunitys.
What about the return field that everyone loves? That’s the hurdle for the operator to recieve his/her promoted share in a JV or syndication. So what happens when you don’t reach the preferred return during the hold period? You’ve technically breached the original terms of the partnership agreement (and no, it doesn’t matter if you didn’t lose any principal). Profit multiple output can help explain this point. It shows how much money you earned above what you put in. One-point-five multiple sounds awesome…until you remember it requires a decade and all your stress. The number isn’t as important than the context.
The other variable is reinvestment. By extracting cash distributions and plugging them in a low-interest savings account, you’re effectively giving up some purchasing power to inflation. If you simulate a more aggressive strategy by compounding those flows at your desired return rate, every dollar work harder for you. It’s a small thing, but it matters when you are considering long holds on modest assets.
And lastly, base your expectations on the preset comparisons. The risk profile of a steady duplex is different than a distressed value-add play. So don’t expect it to yield the same multiple. Comparing apples to oranges = bad decision. The reference table explains what various multiples mean in terms of gaining (and preserving) capital. It helps you calibrate your risk tolerance. You want a multiple that justifies the unexpected roof leaks and the sleepless nights.
People sell real estate investing as easy money. It is passive money. Not so much. (It’s usually not passive.) Not instant riches. It is not immediate. But if you know where all those dollars are coming from and going to… With a precise account of time and cost, including all fees. Then you’ll have a fair picture of how well or poorly it did. You should of known that. The equity multiple doesn’t lie about the return on your labor. It simply reveals what you earned per dollar.