Internal Rate of Return for Property Calculator
Solve annual property IRR from initial cash invested, yearly cash flows, terminal sale proceeds, selling costs, loan payoff, hold period, appreciation, and reinvestment notes.
🏘Property IRR Presets
📝IRR Inputs
Cash invested at time 0: down payment, closing cash, initial work, and reserves.
The sale proceeds are added to the cash flow in this year.
Use the property value at purchase or a planned exit value, depending on the sale treatment.
Commissions, transfer costs, seller credits, and closing costs as a percent of sale value.
Used for NPV comparison and reinvestment-note math; it does not change standard IRR.
📊Current IRR Snapshot
⚙Formula Breakdown
📋Annual Cash Flow Schedule
| Year | Annual cash flow | Sale proceeds added | Total cash flow | Discount factor at target | Present value |
|---|
🏢Preset Benchmark Table
| Preset | Initial cash | Hold | Year 1 CF | Year 5 CF | Projected sale | Net proceeds | IRR | NPV at target |
|---|
📈IRR Interpretation Table
| Annual IRR | NPV check | Quick read | Primary driver | Next underwriting check |
|---|---|---|---|---|
| Below 0% | Usually negative | Capital loss scenario | Low sale value or negative cash flow | Stress loan payoff and exit value |
| 0% to 6% | Often thin | Low-return hold | Small cash flows or modest appreciation | Compare with lower-risk alternatives |
| 6% to 10% | Depends on hurdle | Moderate property return | Balanced income and sale proceeds | Check vacancy and capex reserve |
| 10% to 15% | Often positive | Strong underwrite screen | Healthy income and exit equity | Verify comps, costs, and rent growth |
| Over 15% | Usually strong | High-return or high-risk case | Leverage, value-add, or optimistic exit | Run downside sale and cash-flow cases |
🔍Sale Proceeds Sensitivity Table
| Scenario | Sale value | Selling costs | Loan payoff | Net sale proceeds | Annual IRR |
|---|
💡Property IRR Tips
When most investor consider purchasing a rental property, they begin with a basic yes-or-no inquiry: Is this an investment worth my purchase? They’ll calculate the rent vs mortgage payment and hope that tiny difference grows into significant value over the years. That math is great if you want to understand your monthly cash flows, but it won’t tell you how efficienty your money is working, or isn’t, while it’s locked inside drywall and concrete.
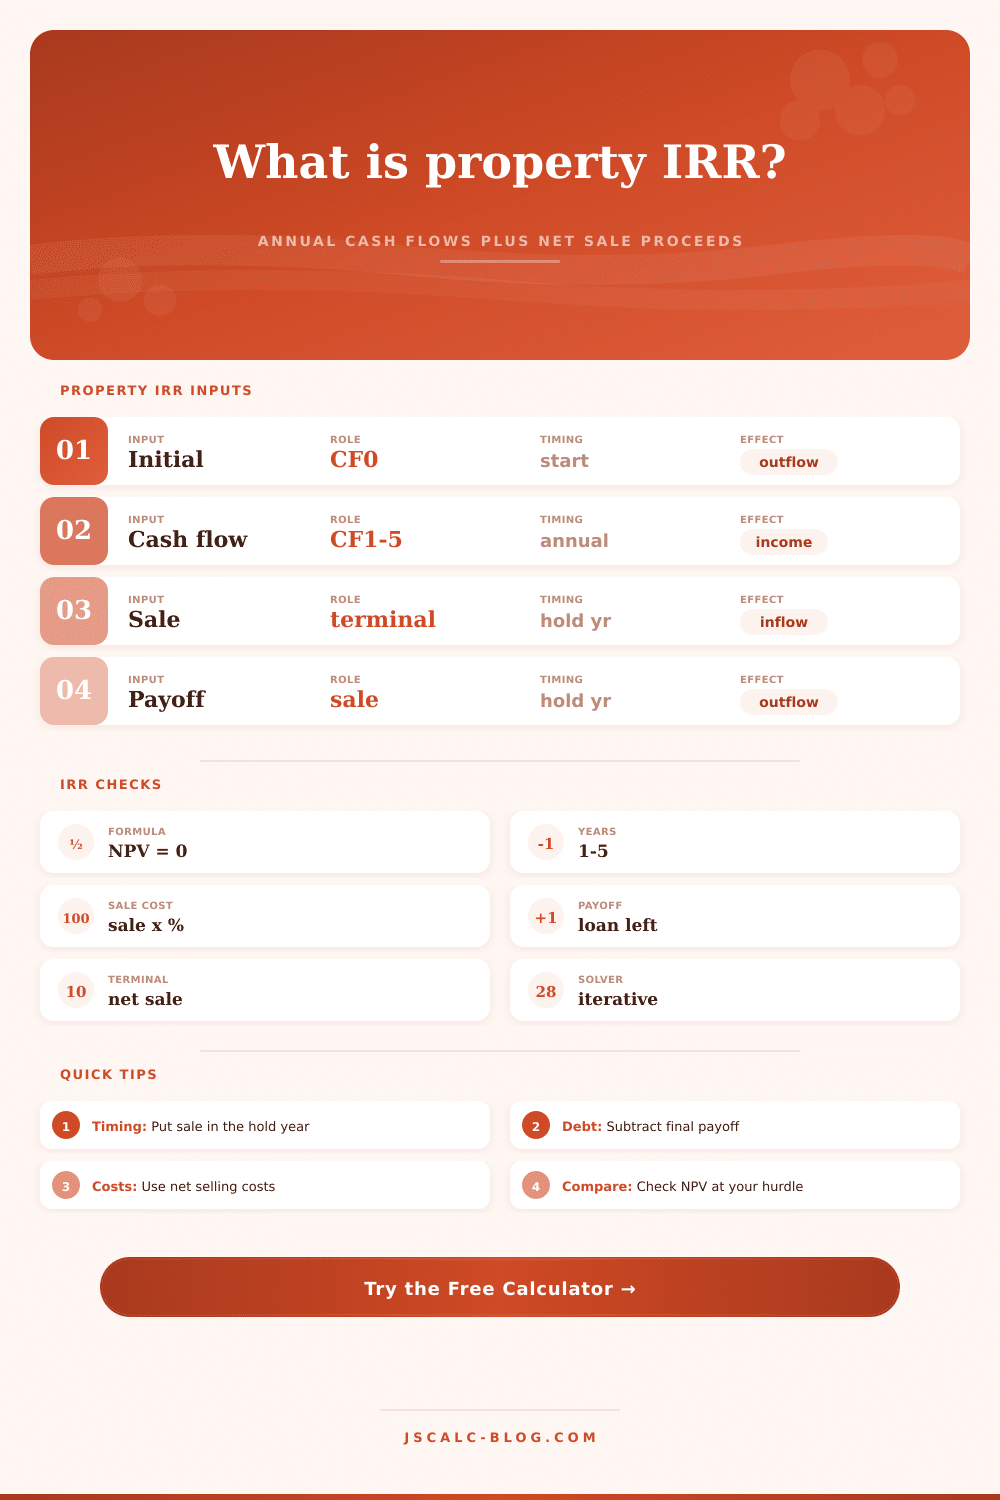
That metric are called “internal rate of return,” which treats each of your dollars as costing a certain amount (depending on when you deploy them). After you’ve defined the timeline, math runs on its own through the calculator above; no need for iterative formulas or discount rates. You start with your first investment at time zero. Every penny of your initial repairs, closing costs, and down payment gets dumped into this first bucket. Because money spent early has most compounding opportunity compared to money spent later, this becomes standard against which all future gains will be measured. It’s a slight distinction but it makes all the difference in terms of your perspective on leverage.
How to Calculate Your Real Investment Return
From there, each year, input the net cash flows you’ll reinvest from that investment (this is the cash you get back minus any expenses or taxes). This is important: You’re investing, but still own asset and can keep those returns. Depending on your investor personality, you might invest it right away, put it into a debt payoff plan, or let it sit in your brokerage account. Adjust to match the reinvestment strategy of your choice. The resulting percentage will reflect your real-life spending habits instead off the “ideal” scenario of every penny growing at the pace of the property itself.
Why? A big part of it is the exit strategy: for shorter holds, rental income will be dwarfed by real estate appreciation. You type in how much you expect to sell the property for, plus selling costs (transfer taxes + agent commissions), minus the outstanding loan balance. What’s left over, that net amount, gets deposited into your bank account … all at the end of your holding period. This is by far the biggest mistake people make: They obsess over gross sales proceeds rather than what will land in their pockets after the bank collect its share.
The sweet spot here is something in-between: holding for five years. Any shorter then that, and transaction costs skew things way too much in one direction. Anything longer, and you run into the risk of maintenance costs. You also risk being caught off-guard by the ups and downs of the real estate market.
The table on the page comes in handy because it lets you plug in different scenarios, such as what happens if it appreciates at 5%. What if I pay a higher sales cost?) to see how they affects your total yield. You can determine whether you’re relying too much on over-optimistic assumptions about the sale price. This could prove disastrous if the market take a turn for the worse.
The next step is to compare this IRR with your own hurdle rate (the lowest return that justifies the risk of being a landlord, managing repairs, dealing with tenants, etc.). The question here is whether the calculated number are higher than the return you can recieve from stashing money into some safe index fund or bond. Why? Because if it isn’t, then there’s probably no need to take on the liability for an activity requiring so much more time and energy. This exercise remind you about opportunity cost, forcing you to realize that money invested in one area can’t be earning elsewhere.
That’s why it’s never as simple as “buy for X dollars and sell at Y.” You’ll eventually want to test how robust your returns are by running a scenario where expenses comes in a little higher than expected, or where you get only market value (no markup) on the sale price. How fragile are your returns? How far off could they be from your projections? This difference between what works on paper and what happens in practice is what differentiates amateur investor from veteran ones, those who realize that exit strategy matters as much, if not more, than monthly cashflow.