Projectile Motion Calculator With Air Resistance
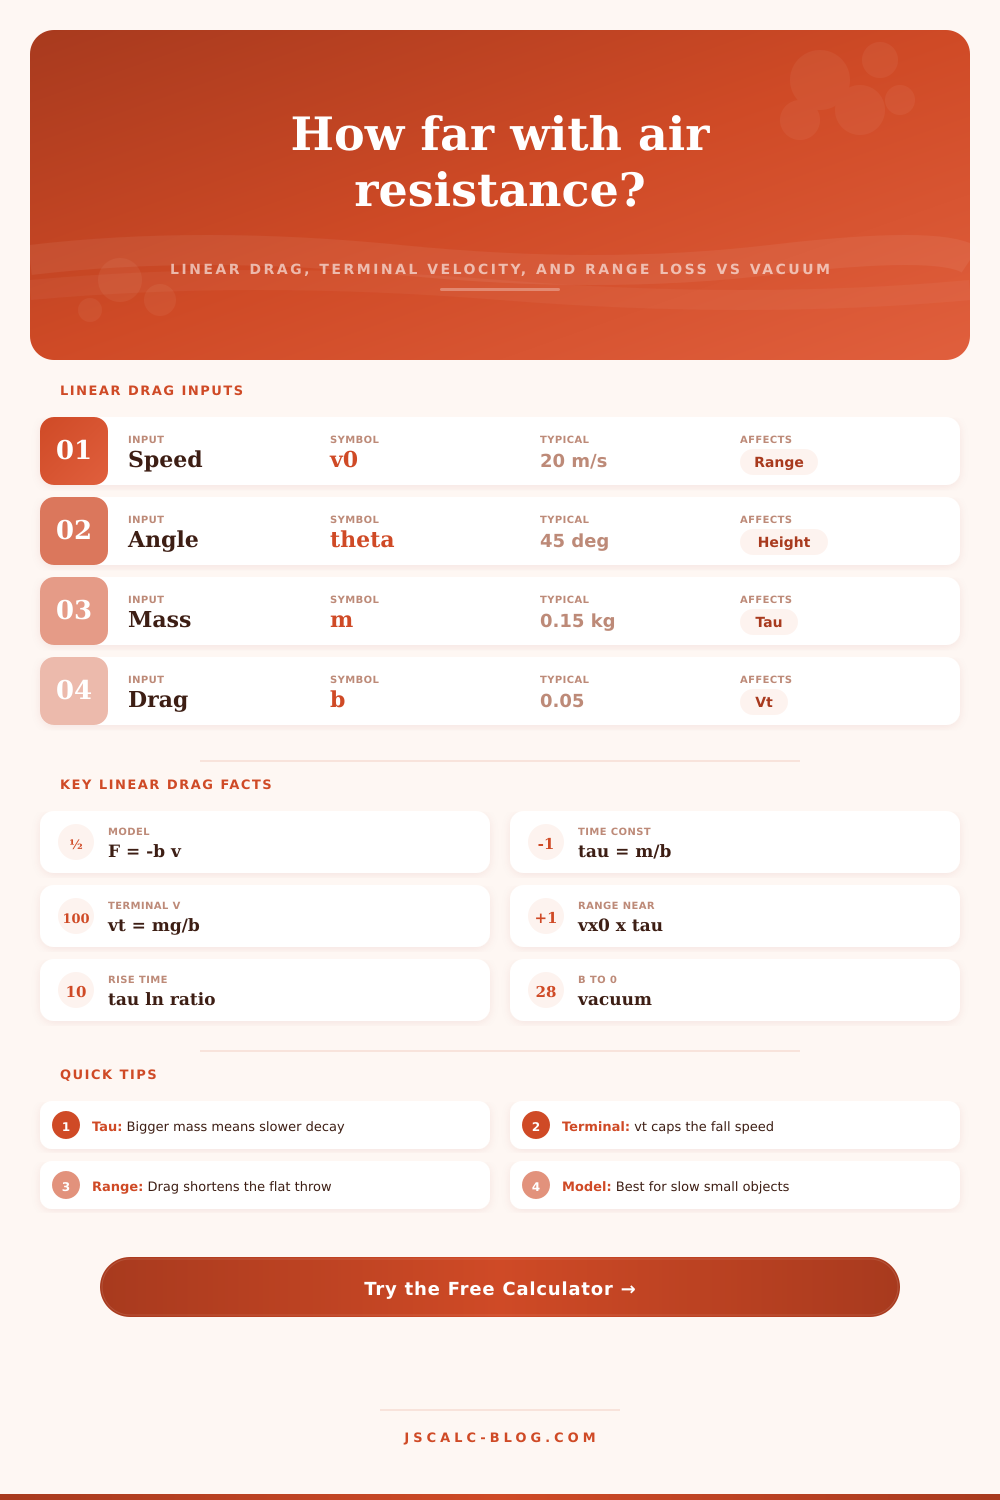
Solve range, maximum height, time of flight, and impact speed using the linear (Stokes) drag model F = −b·v. Enter a drag coefficient or a terminal velocity and see the time constant τ, terminal speed vₜ, and how much drag trims the vacuum range.
🎯Real Launch Presets
📝Launch & Drag Inputs
Used when method is drag coefficient. b = m·g / vₜ.
Used when method is terminal velocity. Sets b = m·g / vₜ.
Smaller steps refine the numerically solved landing time.
🔢Model Snapshot
⚙Linear Drag Equations
🌍Terminal Velocity Examples
| Object | Mass (kg) | b (kg/s) | Terminal vₜ | τ = m/b |
|---|---|---|---|---|
| Foam practice ball | 0.010 | 0.020 | 4.9 m/s | 0.50 s |
| Ping-pong ball | 0.0027 | 0.006 | 4.4 m/s | 0.45 s |
| Baseball (approx) | 0.145 | 0.050 | 28.5 m/s | 2.90 s |
| Tennis ball | 0.058 | 0.030 | 19.0 m/s | 1.93 s |
| Steel bearing | 0.130 | 0.010 | 127.5 m/s | 13.0 s |
| Party balloon | 0.003 | 0.040 | 0.7 m/s | 0.08 s |
📉Drag Effect vs Vacuum (v₀ 20 m/s, 45°, m 0.145 kg)
| b (kg/s) | τ (s) | vₜ (m/s) | Range (m) | Cut vs Vacuum |
|---|---|---|---|---|
| 0.001 | 145.0 | 1422 | 40.24 | 1.3% |
| 0.010 | 14.5 | 142.2 | 35.93 | 11.9% |
| 0.030 | 4.83 | 47.4 | 28.90 | 29.1% |
| 0.050 | 2.90 | 28.5 | 23.83 | 41.6% |
| 0.100 | 1.45 | 14.2 | 16.31 | 60.0% |
| 0.200 | 0.73 | 7.1 | 10.15 | 75.1% |
📐Angle vs Range With Drag (v₀ 20 m/s, b 0.05, m 0.145 kg)
| Angle | Vacuum Range | Drag Range | Max Height | Flight Time |
|---|---|---|---|---|
| 15° | 20.4 m | 15.0 m | 1.4 m | 1.03 s |
| 30° | 35.3 m | 22.3 m | 4.9 m | 1.90 s |
| 40° | 40.2 m | 23.9 m | 7.9 m | 2.35 s |
| 45° | 40.8 m | 23.8 m | 7.7 m | 2.52 s |
| 50° | 40.2 m | 23.3 m | 9.6 m | 2.68 s |
| 60° | 35.3 m | 20.8 m | 13.2 m | 3.03 s |
| 75° | 20.4 m | 13.4 m | 18.9 m | 3.45 s |
🗂Time-Constant Reference (vₜ = τ·g, Earth g)
| τ (s) | vₜ (m/s) | 63% Fall Speed At | Near-Terminal By | Drag Feel |
|---|---|---|---|---|
| 0.1 | 0.98 | 0.1 s | 0.5 s | Very high drag |
| 0.5 | 4.9 | 0.5 s | 2.5 s | High drag |
| 1.0 | 9.8 | 1.0 s | 5.0 s | Strong drag |
| 3.0 | 29.4 | 3.0 s | 15 s | Moderate drag |
| 10 | 98.1 | 10 s | 50 s | Light drag |
| 50 | 490.5 | 50 s | 250 s | Near vacuum |
📊Angle Comparison Grid (v₀ 25 m/s, b 0.06, m 0.15 kg, g 9.81)
| Angle | Vacuum Range | Drag Range | Range Cut | Max Height | Flight Time |
|---|---|---|---|---|---|
| 10° | 21.8 m | 16.5 m | 24.3% | 0.9 m | 0.83 s |
| 20° | 40.9 m | 26.9 m | 34.3% | 3.6 m | 1.61 s |
| 30° | 55.2 m | 32.6 m | 40.9% | 7.6 m | 2.31 s |
| 40° | 62.8 m | 34.4 m | 45.2% | 12.3 m | 2.90 s |
| 45° | 63.7 m | 34.0 m | 46.6% | 14.7 m | 3.15 s |
| 50° | 62.8 m | 33.1 m | 47.3% | 17.1 m | 3.37 s |
| 60° | 55.2 m | 29.7 m | 46.2% | 21.9 m | 3.78 s |
| 70° | 40.9 m | 23.4 m | 42.8% | 26.2 m | 4.13 s |
| 80° | 21.8 m | 13.3 m | 39.0% | 29.4 m | 4.40 s |
💡Linear Drag Tips
Whether it’s throwing a basketball into a hoop or tossing a ball for fun in the driveway, there are two invisible forces battling each other as you do so. One force, gravity, pull the ball downward in a known trajectory. The other, air resistance, resists any forward progress the ball makes. Without air resistance, these two would form a nice parabola in a vacuum that we could easily calculate. With air, however, it adds drag and take away energy at every meter traveled. It alters final destination; not only the speed with which it arrives there, but also its location.
Whether it’s throwing a ball in the driveway, or coaching young soccer player, understanding this is important. All you have to do is plug in the launch angle and speed, and the calculator does the rest. Since it’s using a linear drag model (i.e., assuming air resistance is in proportion to velocity), it saves you from having to guess at conversions and coefficients. For objects such as foam darts or ping pong balls, which are small and don’t move very fast, the air flow remains relatively smooth, making the linear model a good approximation. When they’re big and heavy, however, like a baseball, the drag is more turbulent and proportional to the square of their speed; this calculation treat them as a simplification. Knowing what the model can and cannot do is equally important.
How Air Resistance Changes Ball Flight
First you input the initial launch angle and velocity. Those are simple enough, but how do they interact with air resistance? As it turns out, in a vacuum, a forty-five degree shot maximizes your range no matter the speed. The presence of air changes this equation since the object’s horizontal speed will decrease over time. Holding a flatter trajectory maintains it outside the drag zone for fewer feet at any single moment compared to the same height. When drag becomes important, you’ll see that angles from thirty to forty degrees can travel further then expected. It’s a subtle change, but one that adds to accuracy.
More than vacuum physics, this is about mass: A heavier item will resist the wind’s decelerating force more effectively than a lighter one of equal shape. Using your mass and drag coefficient, the calculator give you a time constant, which represents how fast an object’s velocity reduces. If the time constant is higher, then the object will retain its velocity for a longer period. If it’s lower, well, the thing slows down like a shot. This concept also helps explain why if you throw a ping pong ball and a steel bearing both at equal speed, the bearing will travel farther; the air can’t steal away its momentum quite as easily.
Another key output is its terminal velocity: the speed where air resistance perfectly counteracts the pull of gravity. At that point, the object has reached its maximum speed and no longer accelerates. In general, small, light, fluffy things have a very low terminal velocity (maybe just a few meters per second). Dense spheres has a much higher terminal velocity (more than a hundred meters per second in some cases). And if you throw something really hard up, the tool will tell you how near your actual impact speed was to that theoretical ceiling. Even if you throw something really hard up, if the flight time is long enough, it will reach terminal velocity on its descent anyway.
Launch height is something most of us overlook. If you drop a ball from your waist instead of at shoulder level, it changes the total flight time. This alters amount of time it is affected by air resistance. This is why the solver numerically solves for the split-second when the object touches down on the ground plane you defined. Why? Drag introduces complexity into the equations, making them transcendental. They are also too messy for a simple algebraic formula. Therefore, we need the numerical approach to provide an accurate solution without requiring any advanced calculus skills.
Compare the table of references below (on the page) to get an idea of behavior for various materials. A steel sphere pays little attention to air, but a foam ball loses half its range relative to a vacuum. It’s this difference that makes the sport and material selection interesting from an engineering view. It’s not about throwing distance alone, but energy loss management as well. The kinetic energy lost when interacting with air molecules is gone forever. You can then see how that compares to what would happen under an ideal vacuum.
Drag becomes a tangible thing by seeing what percentage your range drops off. It is not just an arbitrary number; a 40% decrease is significant. That’s a huge change to your game, or experimental setup. It makes you reconsider how hard you really need to throw something to get it where it needs to go. You think throwing harder will fix all your problems? Air resistance doesn’t care: it scales with velocity as well. Eventually you hit diminishing returns. Increasing power only gets you slightly farther, while the drag penalty becomes too high to be worth it.
The last part is the environmental component. If you’re curious how this all pans out in a comparative physics context, the tool’s got you covered; you can toggle your setting from Earth, to the Moon, to Mars (gravity behaves a little differently on each). On Earth, gravity is constant, so the variable that changes things is the air. Changes in temperature and humidity change air density, which changes the drag coefficient; however, these factors do not apply to most casual situations.
For a basic understanding of how fluid impedes movement, the linear model will be enough as a solid base of knowledge. You don’t have to hand-solve differential equations to realize that air isn’t nothing. Air is a medium with pushback. Understanding how it does its pushing-back allows you to throw smartly.