Projectile Motion Calculator With Drag
Model launch trajectories with Newtonian quadratic air drag F = ½ρCd·A·v². Runs a fourth-order Runge–Kutta integration to find range, peak height, flight time, impact speed, terminal velocity, and the vacuum comparison.
🎯Real Launch Presets
📝Launch & Drag Inputs
Used when cross-section input is diameter. Area A = π(d/2)².
Used when cross-section input is area.
🔢Drag Model Snapshot
📈Trajectory Sample Points
| Time (s) | X (m) | Height (m) | Speed (m/s) | Vx (m/s) | Vy (m/s) |
|---|---|---|---|---|---|
| Enter values above to compute the trajectory sample points. | |||||
🔵Drag Coefficient by Shape
| Shape | Typical Cd | Flow Note | Example | Effect on Range |
|---|---|---|---|---|
| Streamlined sphere | 0.10 | Very low separation | Polished ball bearing | Longest, near vacuum |
| Bullet (spitzer) | 0.29 | Pointed, low wake | Rifle projectile | Long, flat path |
| Golf ball | 0.24 – 0.28 | Dimples delay stall | Driven golf ball | Long for its size |
| Baseball | 0.30 – 0.40 | Seams trip flow | Thrown baseball | Moderate reduction |
| Smooth sphere | 0.47 | Classic drag sphere | Cannonball, marble | Noticeable drop |
| Soccer ball | 0.25 – 0.30 | Panels vary wake | Kicked soccer ball | Moderate reduction |
| Hemisphere (cup) | 0.42 – 1.42 | Depends on facing | Parachute-like cup | Large drop |
| Flat plate (face-on) | 1.28 | Full separation | Card broadside | Shortest range |
🌍Air Density by Altitude
| Altitude | ρ (kg/m³) | Temp (°C) | vs Sea Level | Drag Trend |
|---|---|---|---|---|
| Sea level | 1.225 | 15 | 100% | Full drag |
| 1,000 m | 1.112 | 8.5 | 91% | Slightly less |
| 2,000 m | 1.007 | 2.0 | 82% | Less drag |
| 3,000 m | 0.909 | -4.5 | 74% | Longer range |
| 5,000 m | 0.736 | -17.5 | 60% | Much longer |
| Vacuum | 0.000 | – | 0% | No drag at all |
⚙Full Formula Breakdown
🗂Object Comparison Grid
| Object | Cd | Mass (kg) | Diameter | Terminal v (m/s) | Note |
|---|---|---|---|---|---|
| Ping pong ball | 0.47 | 0.0027 | 40 mm | ≈ 9 | Drag dominates fast |
| Tennis ball | 0.55 | 0.057 | 67 mm | ≈ 22 | Slows quickly in air |
| Baseball | 0.35 | 0.145 | 73 mm | ≈ 40 | Classic drag example |
| Golf ball | 0.25 | 0.046 | 43 mm | ≈ 45 | Dimples aid carry |
| Basketball | 0.47 | 0.624 | 239 mm | ≈ 20 | Light for its size |
| Soccer ball | 0.28 | 0.430 | 220 mm | ≈ 25 | Curves with spin |
| Shot put | 0.47 | 7.26 | 120 mm | ≈ 145 | Drag nearly ignorable |
| Cannonball | 0.47 | 10.0 | 120 mm | ≈ 174 | Heavy, near vacuum |
📊Drag vs Vacuum Range
| Launch Case | Speed / Angle | Vacuum Range | Range With Drag | Range Lost |
|---|---|---|---|---|
| Baseball throw | 40 m/s @ 35° | ≈ 153 m | ≈ 95 m | ≈ 38% |
| Ping pong flick | 25 m/s @ 30° | ≈ 55 m | ≈ 12 m | ≈ 78% |
| Smooth sphere | 60 m/s @ 45° | ≈ 367 m | ≈ 250 m | ≈ 32% |
| Cannonball | 120 m/s @ 45° | ≈ 1468 m | ≈ 1087 m | ≈ 26% |
| Flat plate | 30 m/s @ 40° | ≈ 90 m | ≈ 33 m | ≈ 63% |
💡Practical Drag Tips
Most introductory physics classes treats air as if it doesn’t exist. You toss up a ball at some angle and watch its path follow a perfect parabola. It comes to rest exactly where your simple use of trigonometry tells you it should. It’s elegant. It’s clean. But it could of been more wrong.
Real-world objects moving through air have their energy stolen by the air, which is a thick, resisting medium. There isn’t simply a small correction factor between the theoretical trajectory of a vacuum and the way something flies; instead there’s frequently the distance between making a shot and missing it by dozens of meters. That discrepancy is what makes the projectile motion calculator with drag so valuable: it takes all those complex ideas and turns them into real predictions regarding speed, height, and range.
Why Air Slows Down Flying Objects
The core idea here is quadratic air resistance. Drag doesn’t increase in direct proportion to speed: instead it grows with the square of the velocity. Double your launching speed and don’t expect only a doubling of the drag; quadrupling is what happens. Because of that nonlinear behavior, a bullet will lose its energy very quickly. If you’re talking about something coming screaming from end of your hand or out of a barrel. And the calculator above lets you see it in action, showing the effects step-by-step. And the calculator above lets you see it in action, showing the effects step-by-step.
The math that goes into calculating all that is complex. It involve vector math and tracks how horizontal and vertical velocity change as gravity pulls down and air pushes back. All of this is done for you, giving you answers you could never get with simple algebra.
Here’s where most people go wrong: picking the proper drag coefficient. For a smooth sphere, the typical value is approximately zero point four seven. However, it all depends on shape. Despite its dents, a golf ball looks like it should be a poor flyer. Yet those dimples on the surface disrupt the boundary layer of air. This delay when the airflow separates and decreases the wake produced by the ball behind it. These actions lower the effective drag coefficient to approximately zero point two five. That’s a huge decrease in resistance with no increase in frontal area.
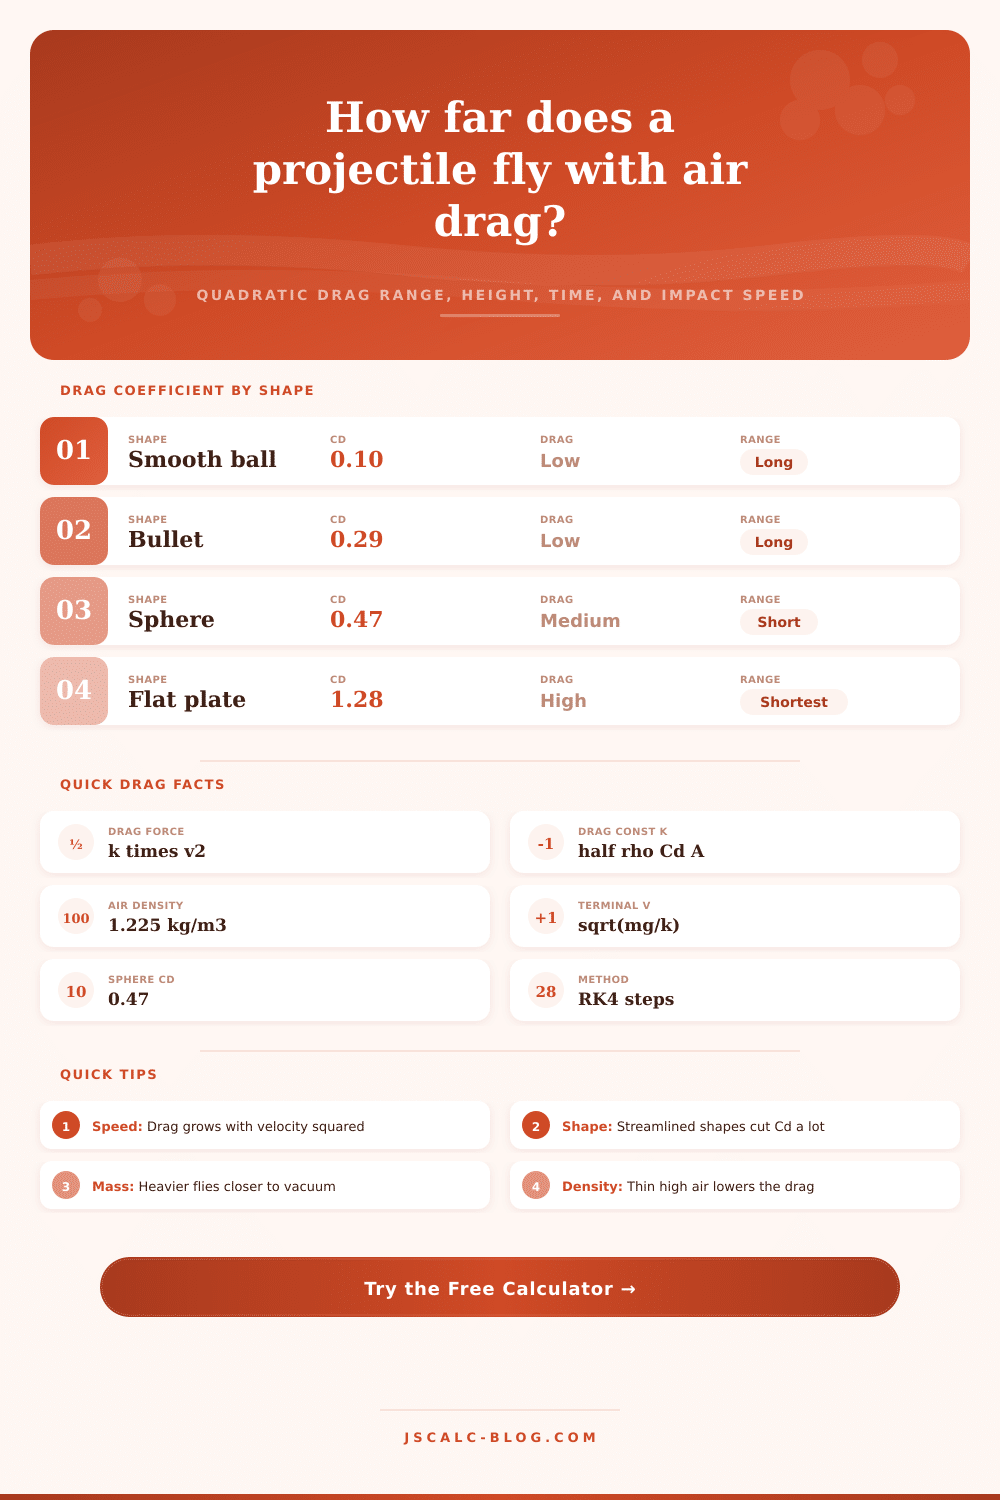
This chart on the page provides an overview of these differences and they illustrate that a streamlined bullet travels much further then a flat plate moving at the same velocity. Its shape will dictate whether it cleanly cuts through air or not and thus what amount of its original kinetic energy remains after the journey.
And this brings us back to a surprising element: Mass matter. More than most people think. You can take two identical sized balls (one made of light plastic like a ping pong ball, one from steel like a cannon ball) and they will behave in very different ways. Mass affects their behavior through inertia, while drag force depend on frontal area and air density. Drag force is a function of frontal area and air density. Acceleration is not. Force over mass equals acceleration. So if an object is heavier, it will resist slowing down from wind forces better. It will keep its speed better because the same amount of slowing force cause less deceleration on a greater mass.
That’s what happens with a feather in air vs. A shot put is in the air. Why does a shot put go almost as far as it would in a vacuum? Because it has more mass, which means more inertia that resist being slowed down by the wind. The calculator lets you play with mass and immediately see this tradeoff, where adding weight costs you aerodynamics.
But altitude does count, albeit usually not as much as speed and shape. Higher elevation equals thinner air and less dense air, which directly reduce drag force. A ball tossed in Denver goes further than one tossed at sea level, not just due to lack of gravity but because it’s encountering fewer things to push aside. The tool allows you to toggle back and forth from standard sea-level density to different altitudes, pointing out how those environmental conditions nudge the eventual landing point. And then it contrasts that with what would happen in a vacuum, revealing just how many meters of distance were eaten up by friction. That’s a sobering number for both athlete and engineer alike, expressed as a percentage loss.
In short, this drag model helps teach us to be modest about our assumptions about motion. That textbook-perfect arc isn’t real; it’s the idealization of a messy world of fluid dynamics. What you see as the numbers settle down after you’ve entered your parameters is a balance between resistance and inertia. It tells you that there’s no free ride across empty space. Everything pays a price for the space it occupies by displacing air, and that cost determines how far you’ll get. Every extra ounce and sleek line of design is something you pay into the ledger of distance.