Probability Calculator
Compute single-event and two-event probability with AND, OR, mutually exclusive, and dependent rules, find the odds and complement, model at-least-one over many trials, and count combinations and permutations.
🎯Real Probability Presets
📝Probability Inputs
Used when input style is direct decimal.
Favorable over total is used when style is fraction.
Chance of B given A already happened.
🔢Symbol Snapshot
📐Probability Rules Reference
| Rule | Formula | When To Use | Worked Example |
|---|---|---|---|
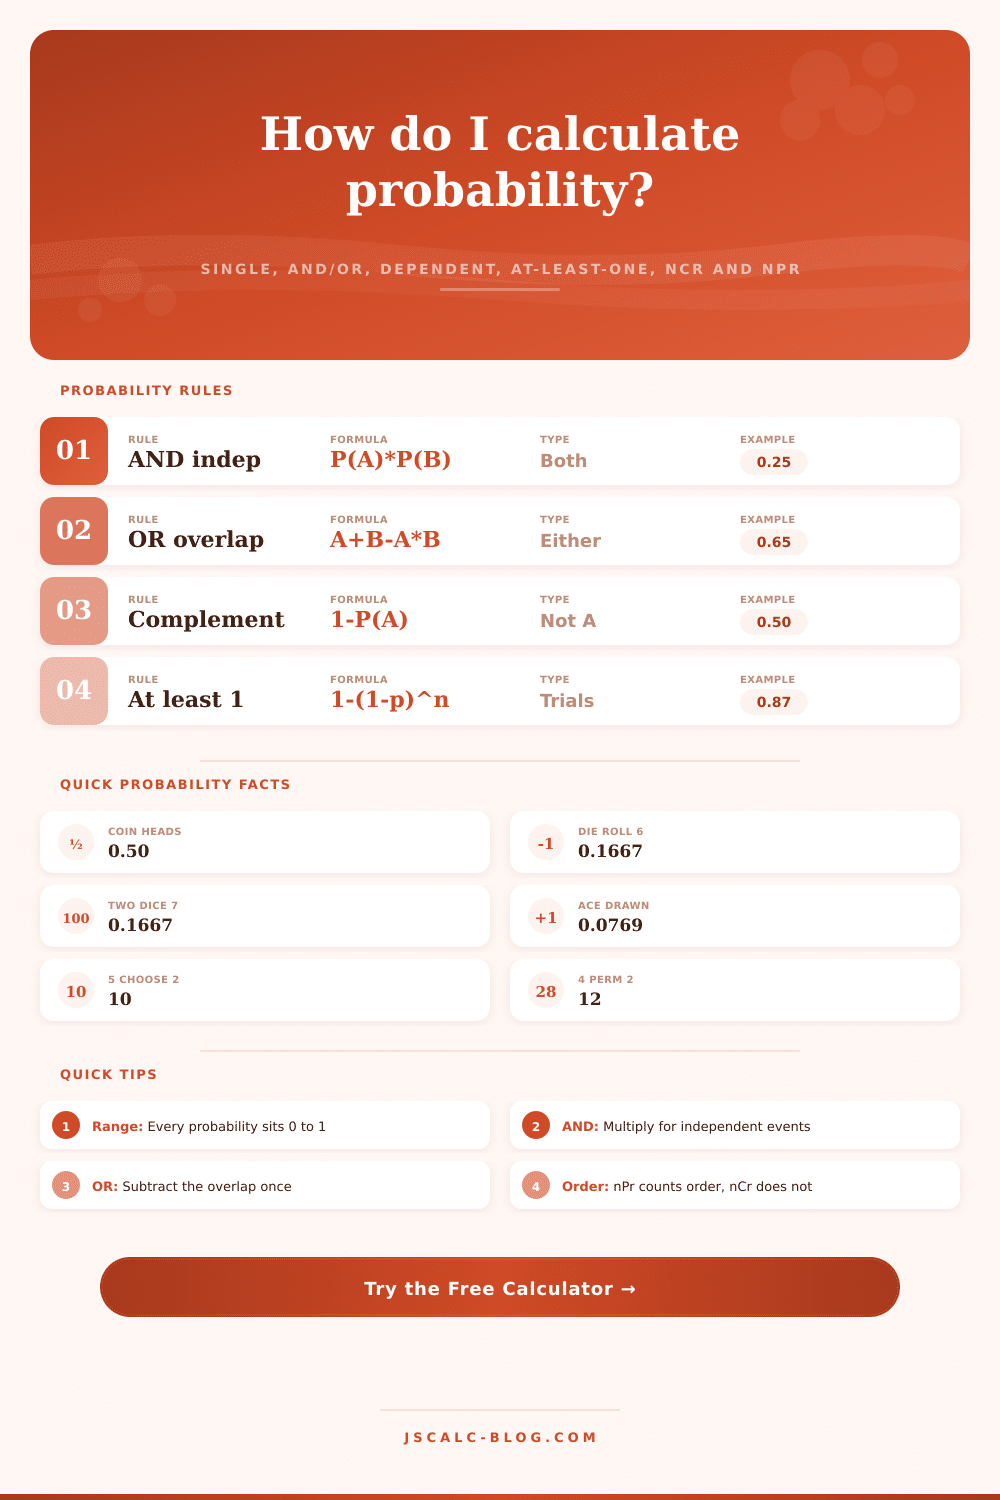
| Complement | P(not A) = 1 – P(A) | Chance the event fails | 1 – 0.30 = 0.70 |
| AND independent | P(A) × P(B) | Both happen, unrelated | 0.5 × 0.5 = 0.25 |
| AND dependent | P(A) × P(B|A) | Second depends on first | 0.31 × 0.24 = 0.074 |
| OR with overlap | P(A)+P(B)–P(A)×P(B) | Either, can co-occur | 0.5+0.5–0.25 = 0.75 |
| OR mutually exclusive | P(A) + P(B) | Either, never together | 0.17 + 0.17 = 0.33 |
| Conditional | P(A and B) / P(A) | B given A occurred | 0.074 / 0.31 = 0.24 |
| At least one | 1 – (1 – p)^n | One or more in n trials | 1 – 0.9^10 = 0.651 |
🧮Combinations and Permutations
| Counting | Formula | Order Matters | 5 Choose / Permute 2 |
|---|---|---|---|
| Combinations nCr | n! / (r! (n – r)!) | No, group only | 5C2 = 10 |
| Permutations nPr | n! / (n – r)! | Yes, order counts | 5P2 = 20 |
| Factorial n! | n × (n–1) × ... × 1 | Full arrangement | 5! = 120 |
| With repetition nPr | n^r | Yes, reuse allowed | 5^2 = 25 |
| Relation | nPr = nCr × r! | Order from groups | 10 × 2 = 20 |
| Symmetry | nCr = nC(n–r) | Choose or leave out | 5C2 = 5C3 = 10 |
🎲Common Odds Reference
| Scenario | Favorable | Total | Probability | Percent | Odds |
|---|---|---|---|---|---|
| Coin lands heads | 1 | 2 | 0.5000 | 50.00% | 1 in 2 |
| Die shows a 6 | 1 | 6 | 0.1667 | 16.67% | 1 in 6 |
| Two dice total 7 | 6 | 36 | 0.1667 | 16.67% | 1 in 6 |
| Draw any ace | 4 | 52 | 0.0769 | 7.69% | 1 in 13 |
| Draw a spade | 13 | 52 | 0.2500 | 25.00% | 1 in 4 |
| Roll a 7 or 11 | 8 | 36 | 0.2222 | 22.22% | 1 in 4.5 |
| Two heads in a row | 1 | 4 | 0.2500 | 25.00% | 1 in 4 |
| Lottery 6 of 49 | 1 | 13983816 | 0.0000001 | 0.0000072% | 1 in 14M |
⚖Odds to Probability Conversion Grid
| Probability | Percent | 1 in N | Odds For | Odds Against | Complement |
|---|---|---|---|---|---|
| 0.05 | 5% | 1 in 20 | 1 : 19 | 19 : 1 | 0.95 |
| 0.10 | 10% | 1 in 10 | 1 : 9 | 9 : 1 | 0.90 |
| 0.20 | 20% | 1 in 5 | 1 : 4 | 4 : 1 | 0.80 |
| 0.25 | 25% | 1 in 4 | 1 : 3 | 3 : 1 | 0.75 |
| 0.3333 | 33.33% | 1 in 3 | 1 : 2 | 2 : 1 | 0.6667 |
| 0.50 | 50% | 1 in 2 | 1 : 1 | 1 : 1 | 0.50 |
| 0.6667 | 66.67% | 1 in 1.5 | 2 : 1 | 1 : 2 | 0.3333 |
| 0.75 | 75% | 1 in 1.33 | 3 : 1 | 1 : 3 | 0.25 |
| 0.90 | 90% | 1 in 1.11 | 9 : 1 | 1 : 9 | 0.10 |
⚙Full Formula Breakdown
💡Practical Probability Tips
Imagine I give you a coin and ask you to hold it in your hand. You know it will land heads or tails, but you have no idea which side faces up. But when it falls onto kitchen counter, you don’t know which side is facing up. That’s probability. And it isn’t magic; it’s just a measurement of our ignorance.
Though everyone thinks they intuitively grasp chance; everybody watches the lottery, plays cards, few do as well as they believe. We’re all wired to find patterns in randomness, meaning we tend to overestimate common occurrences and underestimate rare ones. This is a tool to remove that bias. It provides you with a series of cold, hard numbers for any situation you can turn into math.
What Is Probability?
Defining your universe is the first step. This is what we’d call the set of all outcomes that matter to you vs. This is the set of all potential outcome. On a multiple choice exam with four choices, there are four possibilities; in a deck of cards, there are fifty-two. The calculator crunches this simple math for you. Do you want it expressed as “25%” or do you prefer the fraction (e.g., “one favorable outcome out of four total possibilities”)? It changes both into a neat odds ratio, along with a corresponding clean percentage, that allows you to view the answer in a new way. 25% sounds vague, but “one in four” packs more of a punch, because it suggests that for every time you succeed, you fail three times. This reframing has an impact when real decisions is at stake.
Things get more interesting when events interact. And this is where everyone trips over themselves. The probability that two independent event (such as flipping a coin and then rolling a die) occur simultaneously is simply the product of the two probabilities, simple arithmetic. But what about when the events aren’t independent? That’s when things depend on each other. For example, drawing cards without replacing them completely changes everything. Your initial card influence the set of cards available for the next one. That relationship is conditional. This is conditional probability. Once you’ve seen it, it seems obvious, but in real life it can be really easy to fall down the hole. It needs keeping track of how the first event changes the size of the pool from which the second is drawn. It also moves the pool. The tool helps show these scenarios clearly and reminds you not to treat a dependent event as though it were independent.
And what about order? What if you have to choose between 5 people for a committee of 2? In that case it doesn’t matter who you select first, so you’ve got one team either way. That’s a combination problem. But what if you’re choosing between 5 people to be president and vice-president? Choosing Alice then Bob is very different than choosing Bob then Alice. The order matters, so we call that a permutation. The mistake people make here is confusing these two: after all, both cases involve selecting things out of some bigger set. The difference is completely about whether the order of selection affects the result. Get this wrong, and you’ll either under- or over-count how many possibilities exist, throwing off everything else you calculate after that.
And lastly, what about the “at least one” situation? If I roll a die ten times, how likely am I to see at least one six? Instead of adding up the odds of rolling exactly one six, or exactly two, etc., we could use the complement rule: add together the chances of no sixes, then subtract that number from 1. This short cut is one of those little math tricks that save an enormous amount of effort. With it, you can calculate the chance of zero occurrences and subtract that from one, instead of having to manually tabulate scores of possible outcomes. Again, the calculator does this shortcut for us.
You should of used this earlier. That’s what probability isn’t: a crystal ball. Probability is the picture of uncertainty. Knowing the probabilities leaves the choice up to you. If I say there’s a 60% chance it’ll rain tomorrow, then you must choose for yourself if you want to bring the umbrella. The math lays out the risk. It doesn’t eliminate the risk. And that is exactly what you should of been doing from the start. The results depends on how you use the tool. You could of known more sooner. Actually, it’s moddern math.