Infant Weight Percentile Calculator
Estimate a baby's weight-for-age percentile and z-score for ages 0 to 36 months using WHO and CDC LMS reference data, with unit toggling, preemie age adjustment, and a full formula breakdown.
👶Real Baby Presets
📝Baby Weight Inputs
Use decimals for part months, such as 1.5 for six weeks.
Used when the weight unit is kilograms.
Left box is pounds, right box is ounces. Used in pound mode.
Adjusts age down for prematurity, applied up to 24 months.
🔢LMS Method Snapshot
📊WHO Weight-For-Age Median (kg)
| Age | Boy Median M | Girl Median M | Boy 3rd | Boy 97th |
|---|---|---|---|---|
| Birth | 3.3 kg | 3.2 kg | 2.5 kg | 4.4 kg |
| 1 month | 4.5 kg | 4.2 kg | 3.4 kg | 5.8 kg |
| 2 months | 5.6 kg | 5.1 kg | 4.3 kg | 7.1 kg |
| 3 months | 6.4 kg | 5.8 kg | 5.0 kg | 8.0 kg |
| 4 months | 7.0 kg | 6.4 kg | 5.6 kg | 8.7 kg |
| 6 months | 7.9 kg | 7.3 kg | 6.4 kg | 9.8 kg |
| 9 months | 8.9 kg | 8.2 kg | 7.1 kg | 11.0 kg |
| 12 months | 9.6 kg | 8.9 kg | 7.7 kg | 12.0 kg |
| 18 months | 10.9 kg | 10.2 kg | 8.8 kg | 13.5 kg |
| 24 months | 12.2 kg | 11.5 kg | 9.7 kg | 15.3 kg |
| 36 months | 14.3 kg | 13.9 kg | 11.3 kg | 18.3 kg |
Median values are rounded WHO and CDC style references and interpolate smoothly between the listed ages inside the calculator.
📐Percentile Band Interpretation
| Percentile Range | Z-Score Range | Common Label | How To Read It |
|---|---|---|---|
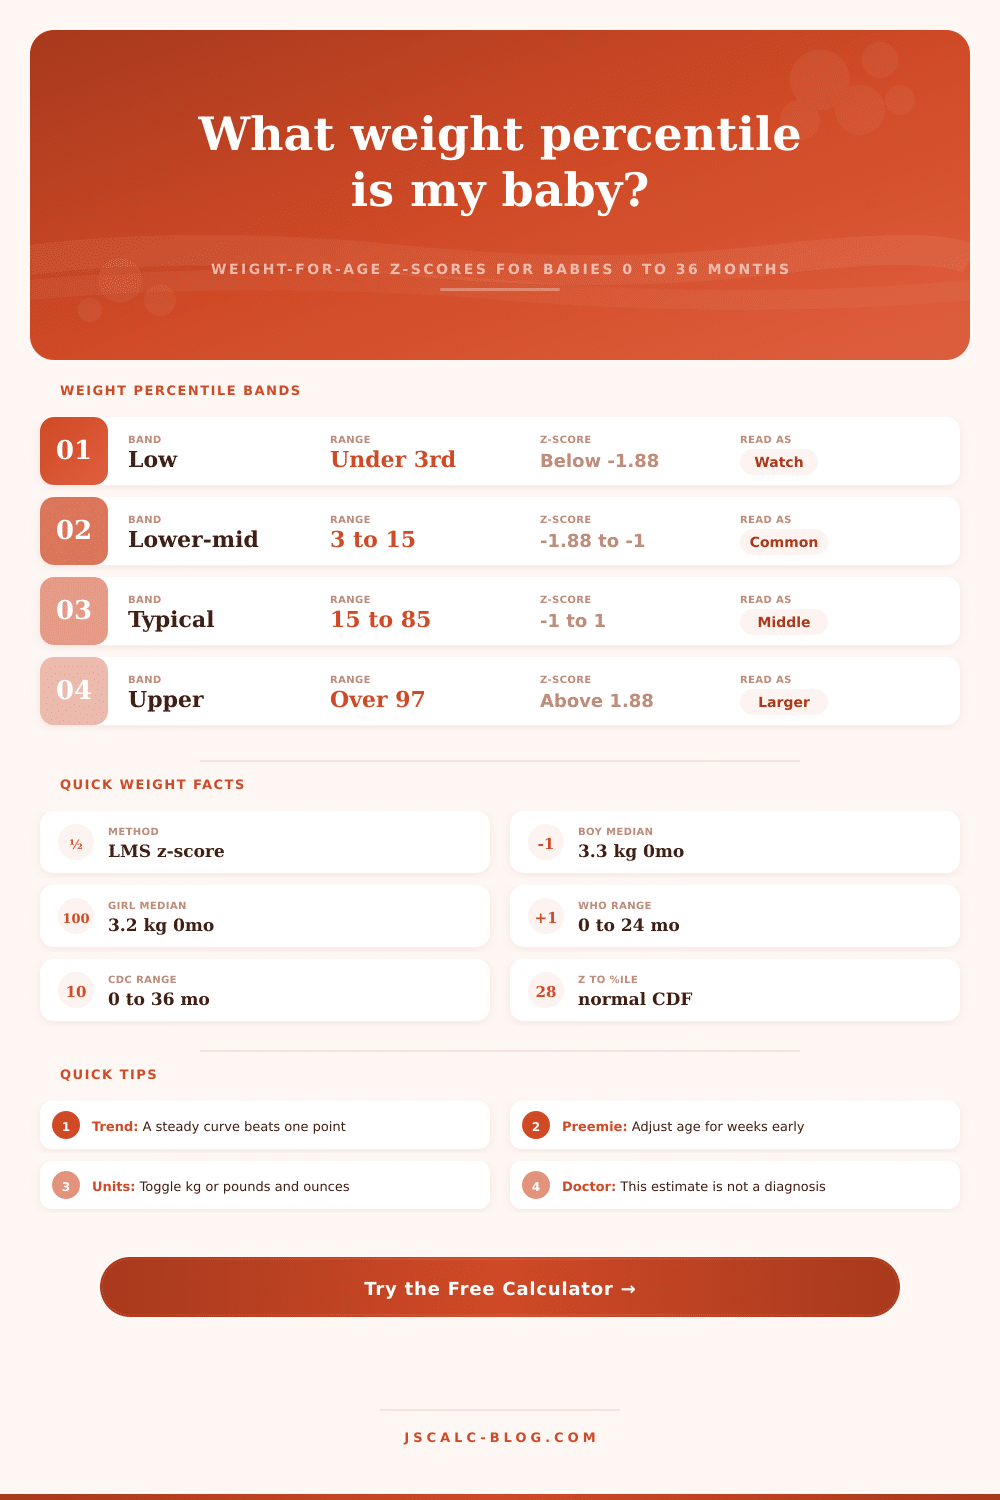
| Under 3rd | Below -1.88 | Low weight-for-age | Discuss trend with a pediatrician |
| 3rd to 15th | -1.88 to -1.04 | Lower-middle | Common and often healthy |
| 15th to 85th | -1.04 to 1.04 | Typical middle | Broad average range |
| 85th to 97th | 1.04 to 1.88 | Upper-middle | Larger than average |
| Over 97th | Above 1.88 | High weight-for-age | Review growth curve over time |
🔗Z-Score To Percentile Reference
| Z-Score | Percentile | Z-Score | Percentile | Meaning |
|---|---|---|---|---|
| -3.0 | 0.1 | +0.5 | 69.1 | Tails are rare |
| -2.0 | 2.3 | +1.0 | 84.1 | 1 SD above median |
| -1.88 | 3.0 | +1.28 | 90.0 | 90th percentile mark |
| -1.28 | 10.0 | +1.64 | 95.0 | 95th percentile mark |
| -1.0 | 15.9 | +1.88 | 97.0 | 97th percentile mark |
| 0.0 | 50.0 | +2.0 | 97.7 | Median equals 50th |
🍼Expected Weight Gain Per Month
| Age Window | Typical Gain / Week | Typical Gain / Month | Boy Median Jump | Girl Median Jump |
|---|---|---|---|---|
| 0 to 3 months | 170 to 227 g | 0.7 to 0.9 kg | +1.0 kg / mo | +0.9 kg / mo |
| 3 to 6 months | 113 to 142 g | 0.45 to 0.6 kg | +0.5 kg / mo | +0.5 kg / mo |
| 6 to 9 months | 85 to 113 g | 0.35 to 0.45 kg | +0.33 kg / mo | +0.3 kg / mo |
| 9 to 12 months | 57 to 85 g | 0.25 to 0.35 kg | +0.23 kg / mo | +0.23 kg / mo |
| 12 to 24 months | 43 to 57 g | 0.2 to 0.25 kg | +0.22 kg / mo | +0.22 kg / mo |
| 24 to 36 months | 34 to 45 g | 0.15 to 0.2 kg | +0.18 kg / mo | +0.2 kg / mo |
🗂Weight Percentile Comparison Grid
| Scenario | Sex | Age | Weight | Approx %ile | Read As |
|---|---|---|---|---|---|
| Average newborn | Boy | Birth | 3.3 kg | ~50th | Right on median |
| Six month girl | Girl | 6 mo | 7.0 kg | ~40th | Typical middle |
| One year boy | Boy | 12 mo | 9.6 kg | ~50th | On the median |
| Two year girl | Girl | 24 mo | 11.5 kg | ~50th | On the median |
| Smaller three month | Boy | 3 mo | 5.5 kg | ~12th | Lower-middle |
| Larger newborn | Boy | Birth | 4.1 kg | ~90th | Larger baby |
⚙Full LMS Formula Breakdown
📋Reference Values
| Item | Common Entry | How It Is Used | Effect On Result |
|---|---|---|---|
| Sex | Boy or girl | Selects the LMS curve set | Girls run 5 to 10% lower M |
| Age | 0 to 36 months | Interpolates L, M, and S | Median rises with age |
| Weight | 2.5 to 16 kg | Value X in the z-score | Higher X raises percentile |
| Chart standard | WHO or CDC | Chooses reference source | Small band differences |
| Weeks early | 0 to 16 weeks | Lowers effective age | Raises percentile for age |
💡Practical Weight Tips
This infant weight percentile calculator is an informational estimate built on rounded WHO and CDC style reference values, not medical advice or a diagnosis. Always consult your pediatrician about your baby's growth.
You look down at the number, then close the scale. Did it mean you’ve been keeping your baby alive? Or was it a sign of there thriving? If you’re a new parent, you know this can be an anxious time, waiting for doctor to explain what numbers mean. That one number on that one day doesn’t tell you much about how your kid will do in the long run. What matter are trends across months and even weeks.
To ease some of the daily anxiety, there is tools to help track weight-for-age percentiles. In doctors’ offices, numbers makes more sense once you know what percentile means. Traditional growth charts don’t draw a straight line connecting age with weight, it’s more like a series of pulses. That’s because infants don’t gain weight consistantly; their body type change dramatically over time. To reflect this, moddern health organizations have adopted advanced statistical models called LMS methods that model the skewing of infant weight curves over time.
How to Understand Your Baby’s Growth Chart
Given your baby’s age, sex and weight, the calculator above will feed that into complex equations and tell you exactly where he or she fit on that bell curve. Instead of relying on a jagged guess, it will fill in the gaps between standard data points so that it can gives you a smooth estimate. Boys grow different than girls, particularly during the first year of life. Mixing them up can result in false alarms. Typically, what they’ll spit out for you is a z-score and percentile rank.
Don’t be intimidated by those words. It is just a measurement of how many standard deviations you are from average. If you have a z-score of 0, then your baby is smack dab on the average line. Z-scores above 0 mean your baby is heavy for his age; below 0 mean light. There is no need to commit to memory exactly which number represents what cutoff. Most healthy babies will fit into the third to ninety-seventh percentile range. That help you put things into perspective.
Just because someone is on the lower end doesn’t automatically mean that their kid is malnourished. Similarly, just because someone is on the higher end doesn’t necessarily mean that their kid is destined to become a sumo wrestler. It’s simply a way to describe where your child falls among a reference population at this particular point in time.
If you are dealing with a preemie, however, things gets more complicated: Chronological age is not the same as biological age. Because your baby was born six weeks too soon, he or she did not experienced that last critical period of development in the womb. That means it wouldn’t of been accurate… Or fair!, to compare her weight against a full-term standard right away. In fact, most pediatric recommendations is to use corrected age through at least year two. By doing this, they’re moving your timeframe back to match the date the baby would of been born had they never left the womb.
You can put in weeks early into the tool which will adjust the denominator to reflect that. The resulting percentile will then represent true developmental progress, not simply calendar time. Growth varies. Babies have growth spurts where they shoot up in weight and then level off for weeks. Sometimes their energy goes to motor skills and sometimes it go to neurological development. All of this can seem erratic on paper, but it’s completely healthy and normal (just a seesaw). What matters is whether they are consistent along their own curve.
So, for example, if your child has always tracked along the fortieth percentile, they is likely perfectly healthy there. Only when percentiles plummet across visits do doctors begins to suspect an issue with absorption or feeding. At the end of the day, however, a growth chart is just a map, not a judgement. It provides context for what’s going on but doesn’t tells you how to feel about it.
To see how the numbers work, we have included formulas and reference charts to show you how the math are done. But remember: Each baby is different; each one beats his or her own drum. This isn’t supposed to make you push your kid toward some arbitrary average. This is supposed to help you know he or she is progressing in a way that feels sustainable and strong to him (or her). Don’t put too much stock in a single data point. Trust the trend line instead.