Price Per Square Foot Calculator
Work out price per square foot or price per square meter from a home price and living area, reverse-solve the implied price or size, and compare up to five listings against the average to instantly spot the best value on a dollars-per-square-foot basis.
📐Choose a Mode
🏡Real Listing Presets
📝Property Inputs
Applies to every living-area and lot field below.
Only used in Reverse mode; pick the unknown.
Total asking or purchase price of the property.
Gross living area in the selected unit, above grade.
Reverse mode: the $/sqft or $/sqm benchmark to apply.
Total lot area for lot price per sqft and per acre.
Unit for the lot field; acre = 43560 sqft.
Leave a row at 0 to skip it. Uses the area unit selected above.
🔢Formula Snapshot
📊Live Listing Comparison Grid
| Property | Price | Living Area | $ / Sqft | Vs Average % |
|---|---|---|---|---|
| Switch to Compare mode and press Calculate to populate this grid. | ||||
📈Price and Area to Dollars per Sqft
| Price | Living Area | $ / Sqft = Price / Area | Reads As |
|---|---|---|---|
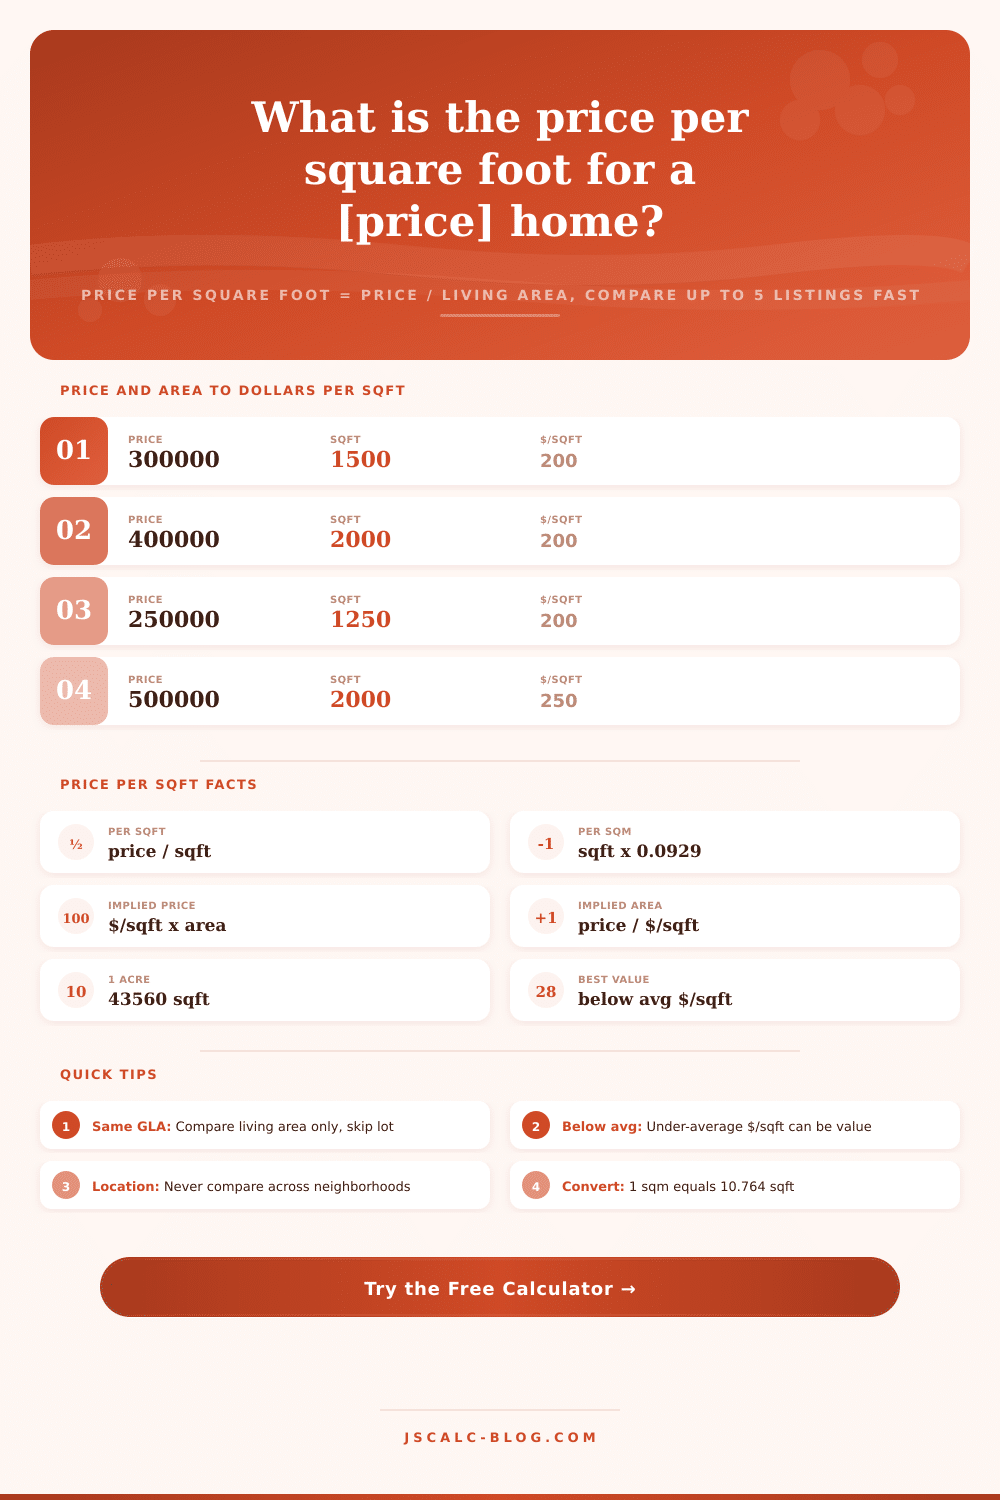
| $300,000 | 1,500 sqft | $200 | Entry level |
| $400,000 | 2,000 sqft | $200 | Mid market |
| $250,000 | 1,250 sqft | $200 | Affordable |
| $500,000 | 2,000 sqft | $250 | Premium |
| $450,000 | 1,500 sqft | $300 | High end |
| $720,000 | 2,400 sqft | $300 | Luxury |
| $275,000 | 1,100 sqft | $250 | Compact |
| $600,000 | 2,400 sqft | $250 | Family sized |
📏Area Unit Conversions
| Unit | Equals | In Square Feet | Note |
|---|---|---|---|
| 1 sqft | 0.092903 sqm | 1 sqft | Base US unit |
| 1 sqm | 10.7639 sqft | 10.7639 sqft | Metric area |
| 1 acre | 4046.86 sqm | 43,560 sqft | Standard lot |
| 1 hectare | 2.47105 acres | 107,639 sqft | 10,000 sqm |
| $100/sqft | $1,076.39/sqm | Multiply x 10.7639 | Rate convert |
| $200/sqft | $2,152.78/sqm | Multiply x 10.7639 | Rate convert |
🗄Value Read: $/Sqft vs Market Average
| Listing | Price | Sqft | $/Sqft | Market Avg | Vs Avg % | Value Read |
|---|---|---|---|---|---|---|
| Cottage | $285,000 | 1,500 | $190 | $225 | -15.6% | Strong buy |
| Ranch | $450,000 | 2,200 | $205 | $225 | -8.9% | Good value |
| Colonial | $495,000 | 2,200 | $225 | $225 | 0.0% | At market |
| Craftsman | $520,000 | 2,100 | $248 | $225 | +10.0% | Priced high |
| Modern | $600,000 | 2,000 | $300 | $225 | +33.3% | Premium ask |
| Bungalow | $330,000 | 1,650 | $200 | $225 | -11.1% | Good value |
| Estate | $875,000 | 3,500 | $250 | $225 | +11.1% | Priced high |
| Loft | $340,000 | 1,700 | $200 | $225 | -11.1% | Good value |
⚙Formula Breakdown
💡Smart Comparison Tips
The price is per square foot. Real estate are compared based off price per square foot. This is your exchange rate, how much are you getting for every unit of space? “Wow, this $500k house sounds expensive! But wait: it’s three thousand square feet.” “But this other place is just sixteen hundred square feet for four-hundred grand. That’s worse then the first!”
This calculator make both numbers into a single number, allowing you to sort homes quickly without performing mental math. Just enter information into fields to compare the listings side-by-side or solve for any missing variable. It will convert units and compute price per square foot automaticly for you.
How to Use This Calculator
This is the metric to understand, it’s simple: it’s total price divided by living area. The most common mistake are in denominator (aka “living area”). You don’t want to add areas that aren’t actualy livable. Only use finished above-grade space. Do not include yards or unfinished basement. This is key to making sure the comparisons are apples-to-apples.
The rates will not compare if one listing have a renovated cellar while another doesn’t; keep your inputs clean, and comparison will be honest. In addition, it converts square feet into square meters (handy if you have foreign investor/are listing properties internationally). For reference, a square meter is approximately equal to 10.76 square feet. The calculator displays both rates on the same page. So you can quickly determine whether a given price is actualy “cheap” once adjusted for units, and eliminate any uncertainty when converting between them.
And reverse solving give you additional analytical strength in practical ways, since it uses market information to frame financial parameters. Put a specific price per square foot next to a specified living area and see what price you get. This is your implied fair price. Use it as a reality check against the asking price. Want to know what house is worth? How big of a place can I afford with my budget?
The power of this tool is when you compare more than one listing. You can put in up to five property side-by-side for comparison. The app calculates each rate and the average of all rates, then displays how much each property’s rate differ from that average to make best value (the lowest cost per sq. Ft.) stand out. Ft.) jump off the screen.
But remember: just because it’s cheap doesn’t mean it’s a good deal. It could be a gem, needing some work, in a terrible neighborhood, or dated. That decision require judgment, not data. Smaller houses has higher prices per square foot. This is because fixed expenses, such as bathrooms and kitchens, is divided among fewer square feet, which means smaller homes will be priced at a higher rate mathematicaly speaking.
Buyers frequently get thrown by this, thinking “objectively, a bigger house should cost less per foot.” A smaller cottage might cost more per foot but add up to less in total. This makes it affordable even though it’s pricey on a unit basis. Don’t dismiss smaller homes just because their prices-per-foot seem steep.
This metric will be blind to lot size and also to the condition of the house. Use it as a filter, not the ultimate answer. You could have two houses with same dollars per square foot, one a fixer upper and another a renovated home, and they may have different true values. The calculator can helps you raise up some candidates to look at and flag out some obvious outliers… but then double-check things in person.
The goal isn’t to find the lowest price per square foot; the goal is to find the best house for your money. When you combine data with an in-person inspection, you’ll stop chasing numbers and start finding homes that suit your life.