Pressure to Temperature Converter
Find the saturation temperature for a refrigerant or steam pressure, or solve an ideal-gas pressure-temperature change. Refrigerant blends use interpolation from built-in P-T charts; water and steam use the Antoine equation.
🎯Real Pressure Presets
📝Conversion Inputs
Used in saturation mode. Ideal-gas mode ignores the fluid.
Refrigerant gauges read gauge pressure. inHg vacuum is treated as pressure below one atmosphere.
Sea level is 14.696. Lower it for altitude when converting gauge to absolute.
P1 and P2 use the pressure unit and basis chosen above. Volume is held constant.
🔢Unit & Formula Snapshot
❄R-410A P-T Chart (Gauge)
| Temp °F | Temp °C | Pressure psig | Pressure psia | Pressure bar (g) |
|---|---|---|---|---|
| -20 | -28.9 | 26.2 | 40.9 | 1.81 |
| 0 | -17.8 | 48.2 | 62.9 | 3.32 |
| 20 | -6.7 | 78.4 | 93.1 | 5.41 |
| 40 | 4.4 | 118.4 | 133.1 | 8.16 |
| 60 | 15.6 | 170.1 | 184.8 | 11.73 |
| 80 | 26.7 | 235.7 | 250.4 | 16.25 |
| 100 | 37.8 | 317.6 | 332.3 | 21.90 |
| 120 | 48.9 | 418.3 | 433.0 | 28.84 |
| 130 | 54.4 | 476.8 | 491.5 | 32.87 |
🧊R-22 & R-134a P-T Charts (Gauge)
| Temp °F | Temp °C | R-22 psig | R-134a psig | R-22 bar (g) | R-134a bar (g) |
|---|---|---|---|---|---|
| -20 | -28.9 | 10.2 | -3.6 | 0.70 | vacuum |
| 0 | -17.8 | 24.0 | 6.5 | 1.66 | 0.45 |
| 20 | -6.7 | 43.1 | 18.4 | 2.97 | 1.27 |
| 40 | 4.4 | 68.6 | 35.0 | 4.73 | 2.41 |
| 60 | 15.6 | 101.6 | 57.4 | 7.01 | 3.96 |
| 80 | 26.7 | 143.6 | 86.7 | 9.90 | 5.98 |
| 100 | 37.8 | 195.9 | 124.2 | 13.51 | 8.56 |
| 120 | 48.9 | 260.0 | 171.2 | 17.93 | 11.80 |
| 130 | 54.4 | 296.9 | 198.7 | 20.47 | 13.70 |
💧Water & Steam Saturation (Antoine)
| Sat Temp °C | Sat Temp °F | Pressure kPa | Pressure psia | Steam psig |
|---|---|---|---|---|
| 40 | 104 | 7.38 | 1.07 | vacuum |
| 60 | 140 | 19.9 | 2.89 | vacuum |
| 80 | 176 | 47.4 | 6.87 | vacuum |
| 100 | 212 | 101.3 | 14.70 | 0.0 |
| 111 | 232 | 145.0 | 21.03 | 6.3 |
| 121 | 250 | 205.5 | 29.80 | 15.1 |
| 134 | 273 | 304.0 | 44.09 | 29.4 |
| 144 | 291 | 413.6 | 59.98 | 45.3 |
Antoine constants for water (1–100°C): A = 8.07131, B = 1730.63, C = 233.426, with P in mmHg and T in °C. Above 100°C the curve is extrapolated for steam guidance only.
🗂Refrigerant Comparison Grid
| Pressure psig | R-22 Sat °F | R-410A Sat °F | R-134a Sat °F | Typical Role |
|---|---|---|---|---|
| 30 | 6 | -15 | 36 | Low load |
| 60 | 34 | 7 | 62 | Low side idle |
| 75 | 44 | 18 | 72 | Cooling low side |
| 118 | 67 | 40 | 96 | R-410A 40°F target |
| 150 | 82 | 53 | 110+ | Warm ambient low |
| 210 | 103 | 72 | 130+ | R-22 high side |
| 260 | 120 | 82 | 130+ | R-22 hot day head |
| 400 | 130+ | 117 | 130+ | R-410A high side |
Values interpolated from the built-in charts; entries past a chart limit are shown as 130+ or clamped. Saturation temperature is what a P-T chart reads, not the actual line temperature unless the fluid is saturated.
⚙Full Method Breakdown
💡Practical Pressure Tips
Ever seen an air conditioning tech hook up his gauges and stare intently as he reads the pressures? What he’s really doing is reading temperatures based off those numbers. That’s what refrigeration technicians do: they converts one number into another number. You’re hunting for answers you didn’t create if you can’t get your head around this math. The calculator at the top will spit out the answer for R-22 (or R-410A) and other common refrigerants, but understanding how the conversion were made is more important then just pushing a button.
Pressure and temperature is locked together in a closed system. They are not simply correlated; instead, they is physically bound by the law of saturation. As pressure increases so does boiling point of the refrigerant. And likewise, when pressure go up, the temp goes up. This helps techs troubleshoot a system without having to open a line.
How Pressure and Temperature Work Together
They measure suction pressure, then convert it to a saturation temperature and compare it against true air temperature exiting the coil. If the former is different than the latter, they know the system is either undercharged or superheated. It is a little thing but it is very important for system health.
What is it? That’s the trick, most of us don’t know what we’re looking at. Manifold gauges measure gauge pressure (the weight of the atmosphere isn’t accounted for). It automatically converts that into absolute pressure by adding constant 14.7 pounds per square inch that the air presses on everything. So if you forget to do that part in your brain, you’ll have your temperature reading off by several degrees. That’ll lead you to incorrectly diagnose a full system as low and dump out refrigerant when you didn’t need to.
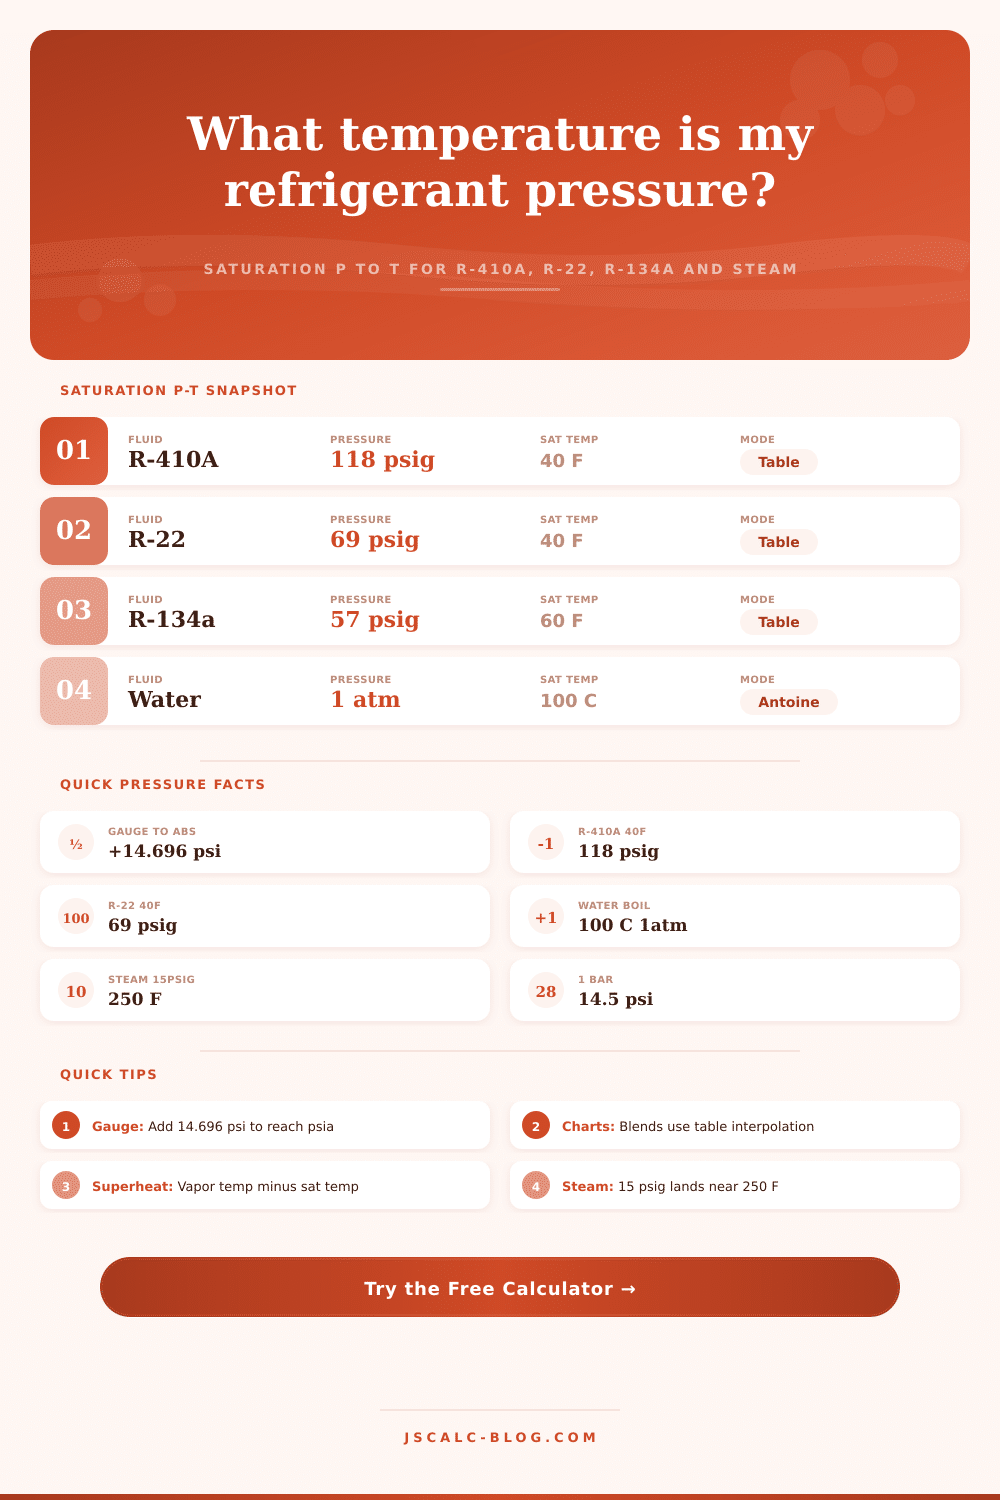
Just double check what your chart is asking for before referencing the number, is it psia or psig? And then there’s the issue of different fluids behaving differently. For example, moddern refrigerants like R-410A run at far higher pressures but produce the same cooling effect as their predecessor, R-22. The chart on the page makes this clear: R-410A is running at 118 psig at roughly 40 degrees Fahrenheit; R-22 require just 69 psig to achieve the same temp. You can’t just mentally swap those figures. And the tool doesn’t make you do that.
It takes into account the non-linear curve of vapor pressure, which levels out at extreme temps. It also does the interpolation from one point on the chart to another so you don’t have to squint at a printed graph in the dark. Steam does have different constants, but it also employ similar physics. For example, water will only boil when it hits 212 degrees, at sea level. If you ascend to a higher altitude, that changes because atmospheric pressure decreases. So if you’re working at elevation, the converter includes a setting to modify local atmospheric pressure.
For industrial processes like sterilizing equipment, this is key: Steam temperature determine how long something needs to be cooked or sterilized. Mess up by a few psi in your autoclave and you end up with contaminated instruments as opposed to clean ones.
The third is the perfect gas mode. It simply glosses over any change of phases for fluids. It just says that as temperature and pressure change, they changes together while one keeps constant volume. If you’ve got some sort of rigid container sitting out in the sun, then its contents will warm up and its gas particles are going to bounce around faster and collide with the walls harder, which increases the pressure. That’s exactly what Gay-Lussac’s law models (a simple linear relation). It is good for estimating tire pressures, checking your pneumatic system, or anything involving a gas but no liquids that could soak up heat energy.
That’s where it comes together: Theory meets practice. Here’s how: Your baseline is called saturation temperature. And now we’re talking about superheat. Superheat is when your vapor line is warmer than the baseline. That warmth indicates the refrigerant has completely turned into a gas before leaving the evaporator. This protects the compressor from getting slammed with liquid (slugged). Are you guessing? No. You get that baseline instantly from the tool.
This is why I compare diagnosing HVAC systems with solving mysteries: until you understand those relationships you’re working with, they feel like guesses. The gauges aren’t magical; pressure isn’t separate from temperature. It’s simply a sign of it within a phase-changing fluid. When you learn not to view them separately, but instead recognize how they’re connected, you don’t need to guess about what’s happening on the other side of that pipe. You can listen to what it’s saying.