Basal Temperature Converter
Convert a basal body temperature reading between Celsius and Fahrenheit at 0.01 degree precision, compare it to your coverline, classify the follicular or luteal phase, and measure the ovulation shift between two mornings.
🌡Real BBT Presets
📝Reading Inputs
Enter the value in the scale selected above.
The line drawn 0.05–0.1°C above your six pre-shift lows.
A recent follicular morning to compare against.
🔢Conversion Snapshot
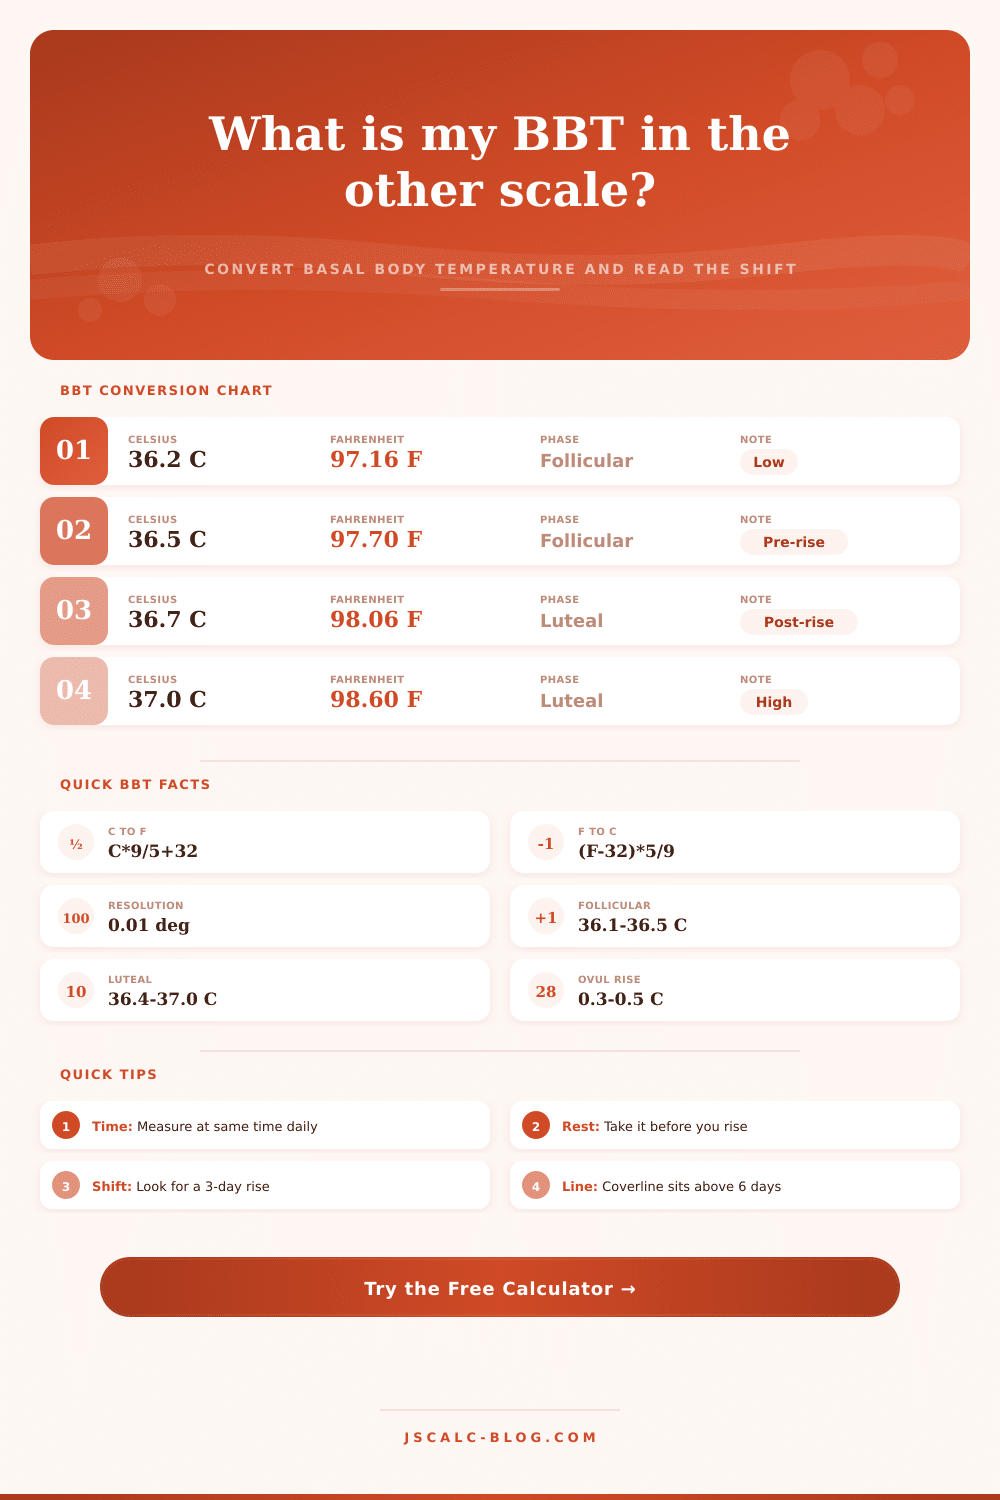
📊BBT Fine Chart (C to F, 36.0–37.5)
| Celsius | Fahrenheit | Celsius | Fahrenheit |
|---|---|---|---|
| 36.0°C | 96.80°F | 36.8°C | 98.24°F |
| 36.1°C | 96.98°F | 36.9°C | 98.42°F |
| 36.2°C | 97.16°F | 37.0°C | 98.60°F |
| 36.3°C | 97.34°F | 37.1°C | 98.78°F |
| 36.4°C | 97.52°F | 37.2°C | 98.96°F |
| 36.5°C | 97.70°F | 37.3°C | 99.14°F |
| 36.6°C | 97.88°F | 37.4°C | 99.32°F |
| 36.7°C | 98.06°F | 37.5°C | 99.50°F |
📉F to C Fine Chart (97.0–98.8)
| Fahrenheit | Celsius | Fahrenheit | Celsius |
|---|---|---|---|
| 97.0°F | 36.11°C | 97.9°F | 36.61°C |
| 97.1°F | 36.17°C | 98.0°F | 36.67°C |
| 97.2°F | 36.22°C | 98.1°F | 36.72°C |
| 97.3°F | 36.28°C | 98.2°F | 36.78°C |
| 97.4°F | 36.33°C | 98.3°F | 36.83°C |
| 97.6°F | 36.44°C | 98.4°F | 36.89°C |
| 97.7°F | 36.50°C | 98.6°F | 37.00°C |
| 97.8°F | 36.56°C | 98.8°F | 37.11°C |
🗂Phase Temperature Comparison
| Phase | Celsius Range | Fahrenheit Range | Vs Coverline | Typical Note |
|---|---|---|---|---|
| Early follicular | 36.1–36.3°C | 97.0–97.3°F | Below | Baseline low temps |
| Late follicular | 36.3–36.5°C | 97.3–97.7°F | At or below | Pre-ovulation dip possible |
| Ovulation day | 36.4–36.6°C | 97.5–97.9°F | Crossing | Rise begins after release |
| Early luteal | 36.6–36.8°C | 97.9–98.2°F | Above | Sustained rise confirms |
| Mid luteal | 36.7–37.0°C | 98.1–98.6°F | Well above | Progesterone plateau |
| Elevated / fever | 37.5°C and up | 99.5°F and up | Far above | Illness, not ovulation |
📏Coverline Guidance
| Step | What To Do | Example Celsius | Example Fahrenheit |
|---|---|---|---|
| Collect lows | Note six pre-rise mornings | 36.30–36.50°C | 97.34–97.70°F |
| Find the peak low | Take the highest of those six | 36.50°C | 97.70°F |
| Add a margin | Raise 0.05 to 0.10°C | +0.10°C | +0.18°F |
| Draw the coverline | Use that as your line | 36.60°C | 97.88°F |
| Confirm the shift | Three highs above the line | 36.75°C+ | 98.15°F+ |
⚙Full Formula & Shift Breakdown
💡Practical BBT Tips
Your routine involves waking up before your alarm goes off and taking your temperature. Is there an increase indicating ovulation? Or has it already come and gone? Your basal body temperature only fluctuates by a fraction of a degree, sometimes less than a degree, which make accuracy essential. You’re looking for a slight difference from day-to-day. If you keep the same level of detail when converting between Fahrenheit and Celsius, you can still detect that increase. Most digital thermometers gives you two decimal places because those last digits matter immensely. Ovulation can mean the difference between 36.50 degrees Celsius and 36.70 degrees Celsius. With only one decimal point, this could be missed.
The calculator translates for you, so you don’t have to guess at the conversion and lose accuracy by trying to do the math in your head. And then, it will match up what you read against a coverline (a reference line found on your chart). That way, if there’s something significant happening, the tool will help you pick out the differences from day-to-day fluctuations due to alcohol or lack of good sleep.
Why Accurate Temperature Matters for Ovulation
But knowing about the rise in temperature makes it more than just a number, it’s a physiological story of what’s happening. Your temperature stays level and low before ovulation because of estrogen. Once the egg drops, progesterone from the corpus luteum cause a rise in your core temp by up to 0.3 to 0.5 degree Celsius. When this happens, you know you’ve ovulated. If you’re monitoring your fertility or simply want to get healthy, realizing this shift can be helpful.
Looking at the chart will give you an idea of where you fit within the range. The reference table show how those ranges matches various stages. The problem with setting the coverline properly is that it’s contextual. You typically need a few days of data before ovulation. This is usually six days, which allows you to draw the line. Once you’ve got that data, you look at the maximum temperature during those initial six days, then add an additional very slight amount of buffer (typically 0.05 degrees Celsius) to set your threshold. If any subsequent temperatures are higher than this number, you know that progesterone has taken hold.
It is frustrating if you’re looking to predict something in real time, but it still is the gold standard for establishing what happened. The calculator shows this immediately and will show where today’s result falls in relation to the line.
The math of how you convert it is only half the equation; consistency in measurement technique is equally significant. Why do we need basal? Your body temperature changes based off the time of day, light, and stress. Take your temperature first thing in the morning before getting out of bed while laying down. Do not talk or move around or even sit up to pee… that can be enough to raise your reading and hide the actual change. It’s tedious work, but it gives you your resting metabolic state isolated from external factors.
Before you blame your hormones, review your routine. Chaotic data mean something is amiss. Basal temperature isn’t really about getting it right, though. It’s more about understanding how your own body works. You need to see what your own biological rhythm looks like and where the low phase sits on that graph. Some women see a flat line before ovulation, some find their temps vary widely throughout the low phase. Both are normal variations of human physiology; neither one is wrong.
The converter will ensure that your personal pattern is correctly measured and fairly compared to the norms. It eliminates the guesswork from phase classification and unit conversion so you can get back to looking at the big picture. Yes, it still requires waking up extra-early for this, but at least you won’t be arguing with yourself over whether that half degree increase was actualy real or if it was just a rounding error.