Pressure Altitude Converter
Convert field elevation, altimeter setting, and outside air temperature into pressure altitude, density altitude, ISA temperature deviation, and the hectopascal equivalent using standard atmosphere aviation formulas.
✈Real Aviation Presets
📝Altitude Inputs
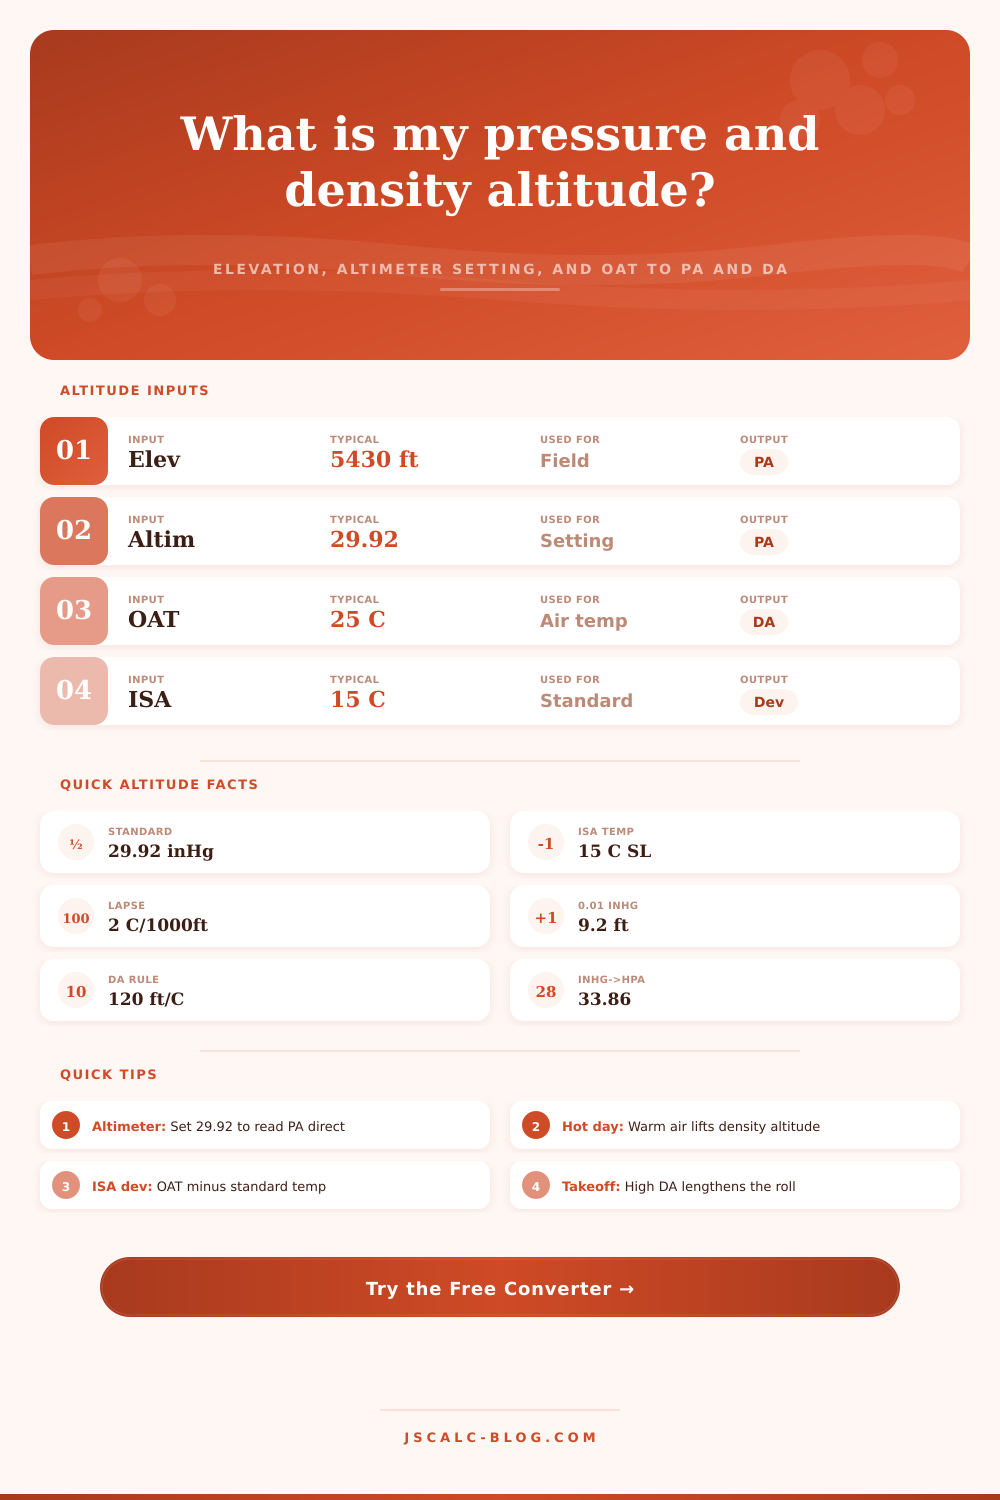
Airport field elevation or your indicated altitude in feet MSL.
Local altimeter (Kollsman) setting, default 29.92 inHg standard.
Same unit as OAT; used only for the spread and humidity note.
Optional context for the density altitude performance note.
🔢Formula Snapshot
📏Altimeter Setting Correction
| Altimeter (inHg) | Diff from 29.92 | PA Correction | Field 5000 ft → PA |
|---|---|---|---|
| 30.42 | +0.50 | –500 ft | 4,500 ft |
| 30.15 | +0.23 | –230 ft | 4,770 ft |
| 29.92 | 0.00 | 0 ft | 5,000 ft |
| 29.80 | –0.12 | +120 ft | 5,120 ft |
| 29.50 | –0.42 | +420 ft | 5,420 ft |
| 29.00 | –0.92 | +920 ft | 5,920 ft |
Rule of thumb: each 0.01 inHg below 29.92 raises pressure altitude by about 9.2 ft; the simplified ×1000 formula rounds this to 10 ft per 0.01.
🌐ISA Standard Atmosphere
| Altitude (ft) | ISA Temp (°C) | ISA Temp (°F) | Pressure (inHg) | Pressure (hPa) |
|---|---|---|---|---|
| Sea level | 15.0 | 59.0 | 29.92 | 1013.2 |
| 2,000 | 11.0 | 51.9 | 27.82 | 942.1 |
| 4,000 | 7.1 | 44.7 | 25.84 | 875.1 |
| 6,000 | 3.1 | 37.6 | 23.98 | 812.0 |
| 8,000 | –0.8 | 30.5 | 22.22 | 752.6 |
| 10,000 | –4.8 | 23.3 | 20.58 | 696.8 |
| 12,000 | –8.8 | 16.2 | 19.03 | 644.4 |
ISA temperature falls about 2°C per 1000 ft: ISA temp = 15 – 2 × (PA / 1000).
🛫Density Altitude Performance
| Density Altitude | True Airspeed vs IAS | Takeoff Roll | Rate of Climb |
|---|---|---|---|
| Sea level | Baseline | Baseline | Baseline |
| 2,000 ft | +3% TAS | +10% longer | –8% |
| 4,000 ft | +6% TAS | +25% longer | –16% |
| 6,000 ft | +9% TAS | +45% longer | –24% |
| 8,000 ft | +12% TAS | +70% longer | –32% |
| 10,000 ft | +15% TAS | +100% longer | –40% |
High density altitude thins the air, so the engine, propeller, and wings all perform as if the aircraft were much higher.
🗂Pressure Unit Comparison Grid
| Altimeter (inHg) | hPa / mb | PSI | mmHg | Diff 29.92 | PA at 3000 ft |
|---|---|---|---|---|---|
| 30.50 | 1032.8 | 14.98 | 774.7 | +0.58 | 2,420 ft |
| 30.15 | 1020.9 | 14.81 | 765.8 | +0.23 | 2,770 ft |
| 29.92 | 1013.2 | 14.70 | 760.0 | 0.00 | 3,000 ft |
| 29.80 | 1009.1 | 14.64 | 756.9 | –0.12 | 3,120 ft |
| 29.53 | 1000.0 | 14.51 | 750.1 | –0.39 | 3,390 ft |
| 29.00 | 982.1 | 14.25 | 736.6 | –0.92 | 3,920 ft |
1 inHg = 33.8639 hPa = 0.4912 psi = 25.4 mmHg. The 29.53 row is the exact 1000 hPa reference point.
⚙Full Formula Breakdown
📋Reference Values
| Item | Standard Value | How It Is Used | Effect on Result |
|---|---|---|---|
| Standard pressure | 29.92 inHg | Reference for the PA formula | Sets the zero point of PA |
| Standard temp | 15°C at sea level | Base of the ISA lapse rate | Anchors ISA deviation |
| Temperature lapse | 2°C per 1000 ft | Falling ISA temp with height | Lowers ISA temp aloft |
| Altitude per inHg | ~1000 ft per 1 inHg | Converts setting to feet | Shifts PA up or down |
| DA temp factor | 120 ft per °C | Adds heat effect to PA | Raises DA on hot days |
💡Practical Altitude Tips
Enter your local barometer into the calculator (above) and you has your pressure altitude…all without having to do any math in your head. Waiting for an altitude clearance just got easier.
Pressure altitude is what your actual height would be if atmosphere were exactly like the one that instrument manufacturers assume it will be. To determine pressure altitude, simply adjust your field elevation based off the current atmospheric pressure. The fewer inches of mercury showing on the altimeter, the less dense air is compared to what instrument makers expect. Your pressure altitude gets higher than ground level.
Why Density Altitude Matters for Pilots
The good news is that this correction normalizes your position relative to a fixed baseline, allowing air traffic controllers to keep everyone separated regardless of weather fronts moving through the region.
That’s not all there is; add to that pressure baseline the density altitude. What really impacts performance are temperature. The International Standard Atmosphere assume a lapse rate of approximately two degrees Celsius per thousand feet. Frequently in the summer months we break that completely. If the outside air temperature is higher than standard, the air molecules spreads out and make atmosphere thinner. Generally speaking, each degree Celsius over the standard add one hundred twenty feet to the density altitude. That directly translates into horsepower lost.
You’re producing less power in thinner air. Your prop produces less thrust, which result in less lift from your wings. Think of it like putting more weight on aircraft without ever picking up a bag of luggage.
When you’re doing your preflight planning, ISA deviation is your best friend. Knowing whether you are running hotter or colder than ISA at any given pressure altitude lets you quantify the loss of performance. Each degree should of be subtracted from your climb gradient if you have a plus deviation (hot air). If you are at an airport with a five thousand foot elevation and it’s a hot day, density altitude can exceeds ten thousand feet. Then a light sport airplane may require twice the runway length to get into the air different than a normal day. True airspeed diverges rapidly from indicated airspeed as conditions degrade, as illustrated on the table below.
The number one pitfall of many pilot is their narrow focus on the altimeter setting without paying attention to temperature. “There’s a high pressure system,” they think, “so I’ll fly great.” What they fail to notice is that this high pressure comes with a concomitant heat wave which render the positive impact of high pressure moot. Water vapor is lighter than dry air and thus humidity has little effect, making temperature by far the primary influence in most GA situations.
Unfortunately, you can’t change weather. But you CAN change what time you leave. Early-morning flying with cooler temps frequently produce big density altitude improvements over holding out for sun to cook the asphalt.
So the bottom line is these numbers. They say what your plane will do in real life versus under vacuum conditions. The tools supply the information. It’s up to you to use good judgment. Flying by the chart isn’t something to only be compliant with. It’s about understanding the physics of flying and giving yourself some wiggle room. When density altitude goes up, make sure you leave room for error. Lighten the load if you can. Or plan on going another day where the air might be a little cooler. And the air won’t care if you have to be somewhere today, and neither should your ego.