Pitch Speed Converter
Convert a baseball or softball pitch between mph, km/h, m/s, and ft/s, then estimate batter reaction time to the plate and the perceived velocity the pitch plays up to from release extension.
⚾Real Pitch Presets
🎯Pitch Inputs
Rubber distance minus stride. MLB is about 55 ft after a 5.5 ft stride.
How far in front of the rubber the ball is released. MLB average is near 6.5 ft.
Baseline extension the perceived velocity is measured against.
Front of rubber to back of plate. Used for the extension effect.
🔢Conversion Constants
📊Speed Comparison Grid
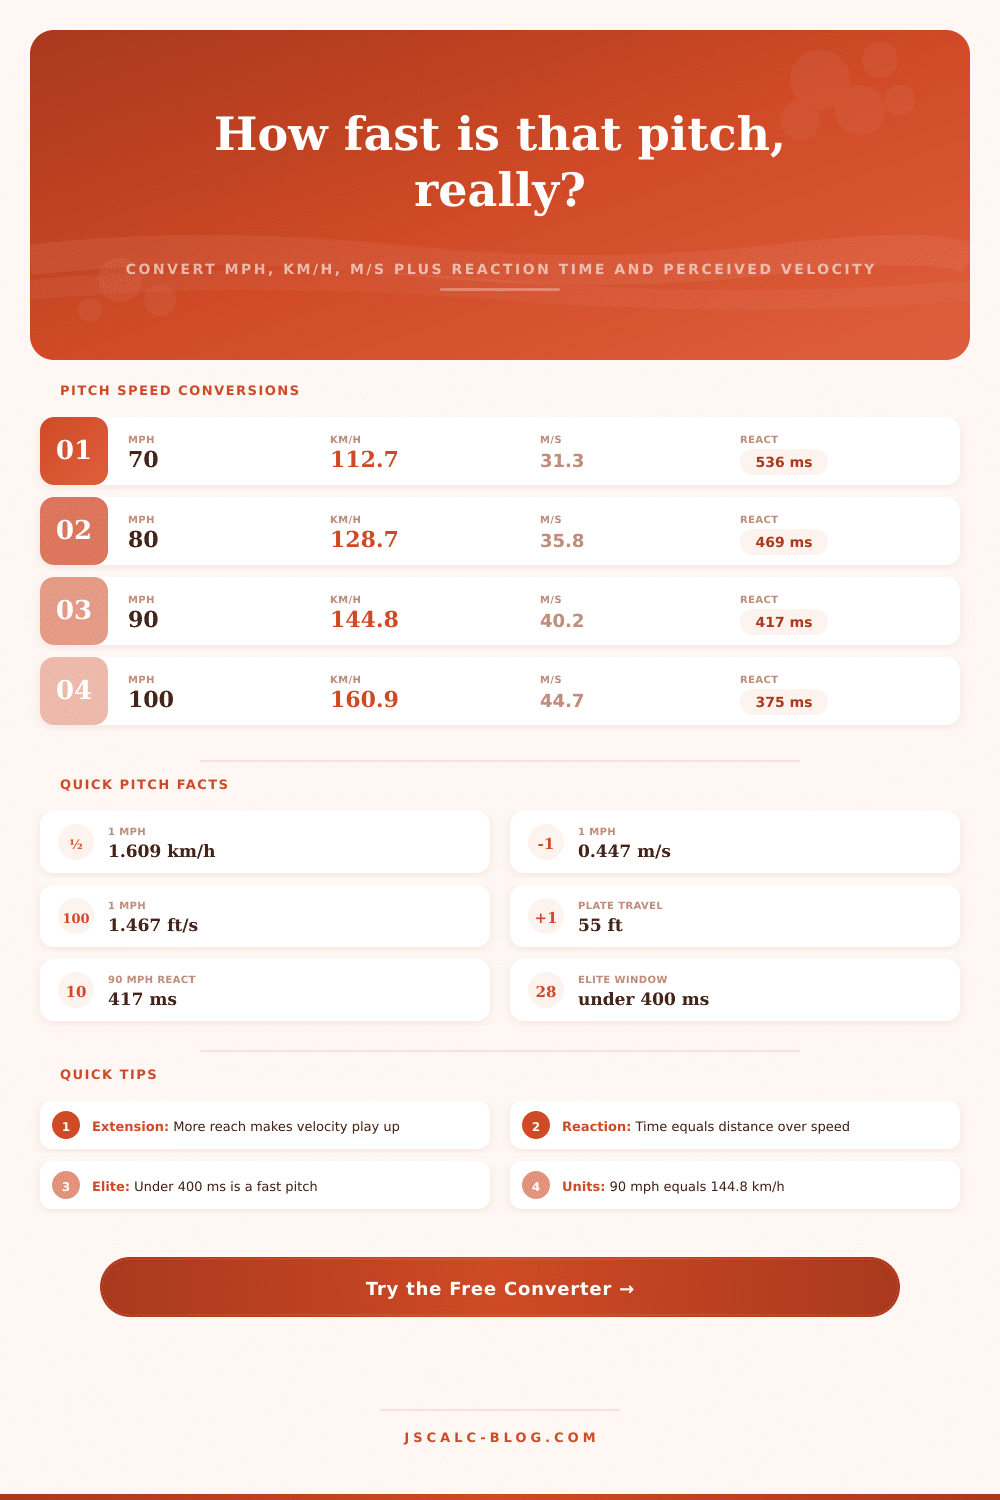
| MPH | KM/H | M/S | FT/S | Reaction (55 ft) |
|---|---|---|---|---|
| 50 | 80.5 | 22.35 | 73.3 | 750 ms |
| 60 | 96.6 | 26.82 | 88.0 | 625 ms |
| 65 | 104.6 | 29.06 | 95.3 | 577 ms |
| 70 | 112.7 | 31.29 | 102.7 | 536 ms |
| 75 | 120.7 | 33.53 | 110.0 | 500 ms |
| 80 | 128.7 | 35.76 | 117.3 | 469 ms |
| 85 | 136.8 | 38.00 | 124.7 | 441 ms |
| 90 | 144.8 | 40.23 | 132.0 | 417 ms |
| 95 | 152.9 | 42.47 | 139.3 | 395 ms |
| 100 | 160.9 | 44.70 | 146.7 | 375 ms |
| 105 | 169.0 | 46.94 | 154.0 | 357 ms |
🏟Pitch Speed By Level
| Level | Typical Fastball | KM/H | Rubber Distance | Plate Travel |
|---|---|---|---|---|
| MLB elite | 95 to 105 mph | 153 to 169 | 60.5 ft | ~55 ft |
| MLB average | 92 to 94 mph | 148 to 151 | 60.5 ft | ~55 ft |
| College (D1) | 87 to 92 mph | 140 to 148 | 60.5 ft | ~55.5 ft |
| High school | 75 to 85 mph | 121 to 137 | 60.5 ft | ~56 ft |
| Little League | 45 to 55 mph | 72 to 89 | 46 ft | ~42 ft |
| Fastpitch softball | 60 to 70 mph | 97 to 113 | 43 ft | ~40 ft |
📏Extension Effect On Perceived Velocity
| Extension | Ball Travel | vs 6.0 ft Base | 90 mph Plays Like | Feel |
|---|---|---|---|---|
| 5.0 ft | 55.5 ft | Longer path | 88.4 mph | Plays down |
| 5.5 ft | 55.0 ft | Slightly long | 89.2 mph | Plays down |
| 6.0 ft | 54.5 ft | Baseline | 90.0 mph | Neutral |
| 6.5 ft | 54.0 ft | Bit shorter | 90.8 mph | Plays up |
| 7.0 ft | 53.5 ft | Shorter path | 91.7 mph | Plays up |
| 7.5 ft | 53.0 ft | Much shorter | 92.5 mph | Plays up big |
⚙Full Formula Breakdown
📋Reaction Time Reference
| Speed | Reaction (55 ft) | Reaction (43 ft softball) | Batter Window |
|---|---|---|---|
| 65 mph | 577 ms | 450 ms | Comfortable |
| 75 mph | 500 ms | 391 ms | Manageable |
| 85 mph | 441 ms | 345 ms | Quick |
| 95 mph | 395 ms | 309 ms | Very quick |
| 100 mph | 375 ms | 293 ms | Elite only |
💡Pitch Speed Tips
Remember, though: The radar gun reading isn’t what you’re feeling in the batter’s box. What it reads is exit velocity at the release point. But it doesn’t account for distance traveled by ball before reaching home plate. When a pitcher releases a 90 mph ball six feet closer to the hitter, they has less time to react then when a pitcher throws 90 mph and releases near the rubber. That’s where raw speed becomes just half of the story. The other half is human element… The split-second decision on whether or not to swing. It also includes distance and some geometry.
Most people view velocity as just a single fixed number. 95 mph, check, I get it, I know the threat level of that now. Nope. That’s where you’re wrong. Above all, with this tool, you just need to enter your specific release extension and it’ll do the math for you. It won’t make you wonder about importance of that extra foot anymore. All you need to do is move the extension input up or down and it will alter the distance the ball travels. Shorter distance = less time for the batter to process the pitch. A longer stride mean a shorter flight path. Enter it into the calculator and it translates that into perceived velocity; i.e. What does that 95 mph fastball realy play like from the hitter’s perspective at the plate?
Why Distance Matters More Than Speed
Let’s talk reaction time output. At major league distances, a 90 mph pitch has about 417 milliseconds of travel time. Sounds like plenty of time…until you realize it take about 200-250 milliseconds for your brain to process the visual information alone. Now you’re down to just a fraction of a second to commit to mechanics and swinging. This is where high speed become overwhelming for an athlete. It squeezes the decision window so much that if you hesitate, you fail. As the tables on the page clearly show, tiny differences in speed drastically reduces available time.
You may be surprised that the level of play matters as much to the inputs as it does. For example, there are distinct mound distances between baseball and softball. Pro baseball plays at 60.5 feet, whereas fastpitch softball is 43 feet. This means a 70 mph fastball in high school baseball presents a far different physical test compared to 70 mph in softball due to its much greater travel distance. When you choose a level, the converter will automaticly account for these established distances so your comparisons are apples-to-apples if you’re adjusting for shortened mounds in youth leagues or comparing across sports. Choosing the right preset guarantees valid comparison; otherwise, it’s apples and oranges.
The forgotten variable in pitching analysis is release extension. You may see two pitcher who show the same speed on radar, but one has better delivery mechanics and a little more reach. What does that do? Developing that extension can be more valuable than trying to throw five miles per hour faster. It is not a trick, just physics. Because he put the ball nearer to where it needed to go. It got there quicker. Getting this kind of extension could of been more helpful than attempting to mechanically generate five miles per hour of extra speed. It changes how the pitch plays without requiring additional arm stress or velocity gains that is notoriously difficult to achieve through training alone. It alters the play off the pitch.
Converting units makes this easy. It’s all about context that gives insight: Meters/second (biomechanics) versus Kilometers/hour (global comparisons). Speed creates pressure, but distance dictates urgency. In other words, we don’t really care how fast a ball leaves the hand, we care how quickly it gets to its target in relation to human brain. That knowledge changes the way we assess performance and who’s good or not. It takes it off of a number and puts it into an impactful situation.
So when you see another speed read, pay attention to where the release occurred. How far does he have left? That perspective shift shows how hard it is to make a hit, even if the gun tells you otherwise.