Piston Velocity Calculator
Find the mean piston speed of a reciprocating engine with MPS = 2 x stroke x RPM, reported in both meters per second and feet per minute, estimate the approximate peak piston speed from the connecting rod ratio, read the engine stress rating, or solve for the maximum safe RPM at a target mean piston speed.
🚗Choose a Mode
🏁Real Engine Presets
🔧Engine Inputs
Full crank travel of the piston, top to bottom.
Applies to the stroke length above.
Crankshaft revolutions per minute for the speed check.
Chooses which units the status line highlights.
Center to center rod length sharpens the peak estimate.
Leave rod at zero to use the simple pi/2 peak.
Used in Max RPM mode to back out the redline.
Controls rounding on every result card.
🔢Formula Snapshot
📋Mean Piston Speed by Stroke and RPM
| Stroke | Engine Speed | MPS (m/s) | MPS (ft/min) |
|---|---|---|---|
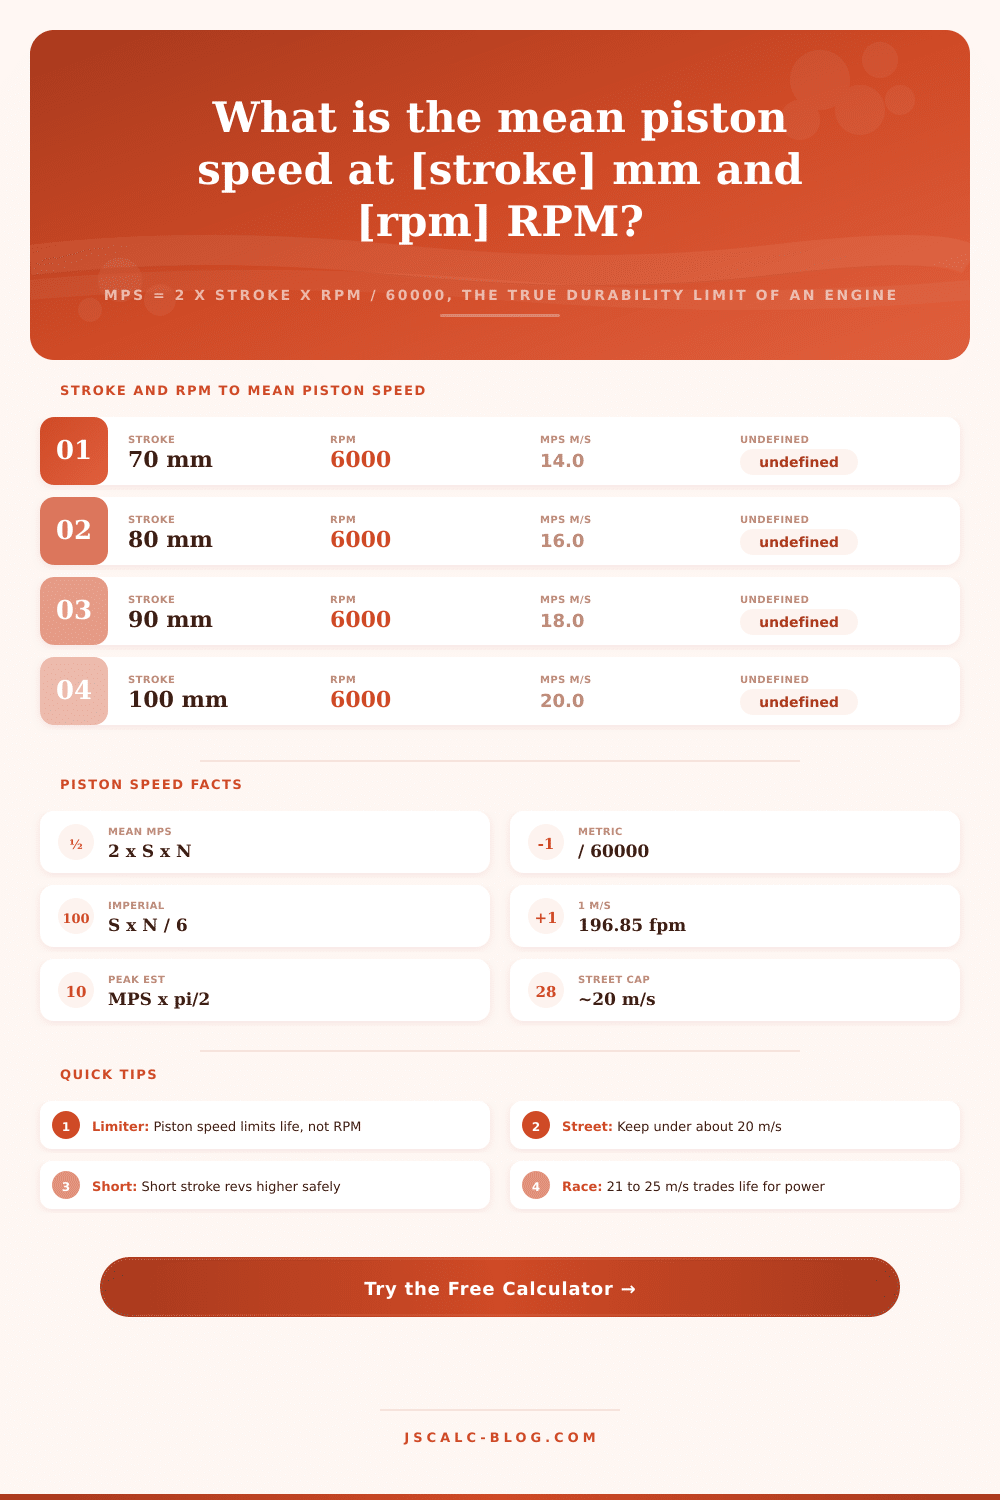
| 70 mm | 6000 RPM | 14.0 | 2756 |
| 80 mm | 6000 RPM | 16.0 | 3150 |
| 90 mm | 6000 RPM | 18.0 | 3543 |
| 100 mm | 6000 RPM | 20.0 | 3937 |
| 90 mm | 7000 RPM | 21.0 | 4134 |
| 80 mm | 8000 RPM | 21.3 | 4199 |
| 70 mm | 9000 RPM | 21.0 | 4134 |
| 60 mm | 10000 RPM | 20.0 | 3937 |
🏁Mean Piston Speed Stress Zones
| MPS (m/s) | MPS (ft/min) | Rating | Typical Use |
|---|---|---|---|
| Under 12 | Under 2362 | Mild | Economy and long-haul engines |
| 12 to 18 | 2362 to 3543 | Street | Everyday passenger cars |
| 18 to 21 | 3543 to 4134 | Performance | Sports and tuned street |
| 21 to 25 | 4134 to 4921 | Race | Circuit and endurance race |
| Over 25 | Over 4921 | Extreme | F1 and short-life sprint |
📏Stroke and Speed Unit Conversions
| Unit | Equals | In Other Unit | Note |
|---|---|---|---|
| 1 in | 25.4 mm | 25.4 mm | Stroke inches to mm |
| 1 mm | 0.03937 in | 0.03937 in | Stroke mm to inches |
| 1 m/s | 196.85 ft/min | 196.85 ft/min | Speed metric to imperial |
| 1 ft/min | 0.00508 m/s | 0.00508 m/s | Speed imperial to metric |
| 1 m/s | 3.281 ft/s | 3.281 ft/s | Meters to feet per second |
| 3.5 in | 88.9 mm | 88.9 mm | Common short stroke |
🧩Engine Type Piston Speed Comparison
| Engine Type | Stroke | Redline RPM | MPS (m/s) | MPS (ft/min) | Zone |
|---|---|---|---|---|---|
| Economy inline-4 | 88 mm | 6000 | 17.6 | 3465 | Street |
| Diesel truck | 127 mm (5 in) | 2500 | 10.6 | 2087 | Mild |
| Street V8 | 88 mm (3.48 in) | 5500 | 16.1 | 3172 | Street |
| LS stroker | 102 mm (4 in) | 6500 | 22.1 | 4350 | Race |
| NASCAR V8 | 83 mm (3.25 in) | 9000 | 24.8 | 4882 | Race |
| Sport bike | 50 mm | 12000 | 20.0 | 3937 | Performance |
| Drag big-block | 114 mm (4.5 in) | 8000 | 30.5 | 6003 | Extreme |
| F1 V6 turbo | 41 mm (1.6 in) | 15000 | 20.4 | 4016 | Performance |
| Redline four | 89 mm (3.5 in) | 7000 | 20.8 | 4088 | Performance |
| 25 m/s limit | 90 mm | 8333 | 25.0 | 4921 | Race |
⚙Formula Breakdown
💡Piston Speed Engineering Tips
One metric is redline RPM. Torque curve. Horsepower. All of these are metrics used for measuring an engine’s potential. But none indicate just how hard the innards of engine are working.
Mean piston speed is the answer; it is the metric for the real-world, durability-limiting aspect of any reciprocating engine. It reflects the friction heat produced by rings and the inertial loads created on the connecting rod. Piston velocity is what engine builders talk about when they debate a high-revving four-cylinder’s longevity or the safety of a stroker combo (even if they don’t say the word).
What is Mean Piston Speed?
The above calculator makes this otherwise unclear engineering parameter real, giving you a figure to base decisions on.
Piston Speed: Mean piston speed isn’t how fast the piston moves at its fastest point; it’s the average velocity over a complete cycle. Mean piston speed is the average speed of the piston during a full cycle. The crank shaft turn one revolution for each two cycles. So the piston travels twice the stroke length for every turn. The simple equation is therefore RPM times two times stroke. With a 90 mm stroke engine turning at 6,000 RPM, that means the math will result in 18 meters per second.
And there’s where folks go astray. They see RPM but don’t consider the stroke length. A 90-mm long-stroke diesel could top out at 2,000 RPM. A short-stroke engine with much shorter piston that don’t travel as far could spin to 15,000 RPM. It’s not all about how fast they spin; it’s also about how far they move.
It will convert units for you. Imperial builders still tend to work with feet per minute and metric shops thinks in meters per second. About one meter per second equals 197 feet per minute. You don’t need to remember this; just know that if you see something like 20 m/s in an old American journal article on performance, it is approximately 3,937 ft/min. It knows both sides and reports them out so you don’t confuse yourself.
It also calculates the maximum piston speed. The mean obscures what realy occurs. The piston surges quickly from the middle of its travel, then stops momentarily at bottom and top dead centers. So roughly 57 times the mean assuming a typical rod ratio. Shorter rods adds more angle to the action, which pushes peak higher. This makes the estimate tighter as you plug in your true connecting rod length. That’s where the additional velocity spike occurs that results in ring land blow-by and valve float.
These numbers should of been understood in context. Engine design has rough areas it guides them around. Mild duty ranges from 0 to 12 m/s (think of this as a diesel intended for truck running decades without being opened). Street engines range from 12 to 18 m/s, which is the sweet spot for reliable operation. Go above 18 and you enter performance land. Above 21 m/s, you’re in race land. Service intervals is dramatically reduced. Above 25 m/s, you enter the extreme. Only sprint races or Formula 1 car live there, and they are scrapped after a weekend’s worth of work.
The calculator will immediately rate what you come up with in terms of these areas. It is a quick sanity check. If you’re looking to build a daily driver and the thing spits out Extreme, you’ve got a problem before you even bolt on the head.
So how does this work in practice? The answer is solving for max RPM. Based off your budget, parts quality, etc., you choose a safe speed limit and back-calculate what the max RPM can be while staying below it. So instead of chasing power it flips the script into one of managing stress. Since short-stroke engines reach their speed limit sooner, they do so at far more RPMs than long-stroke ones. That’s why F1 cars and motorcycles has such small strokes. To get the airflow they need, they have to go to very high RPM, so they just reduce how far each piston needs to travel. The long-stroke engine makes torque but has to remain slow enough to keep reciprocating masses under control.
The final word on mechanical wear comes down to piston velocity. There are no displacement bragging rights or marketing claims; there is just the truth of what the metal must bear. Knowing its number helps you manage an engine’s life expectancy. This applies whether you’re buying into a stroker project or simply wondering how far you can push your daily driver. Let it help you establish the sweet spot of performance versus long-term viability and never forget that there’s always a cost for going to far.