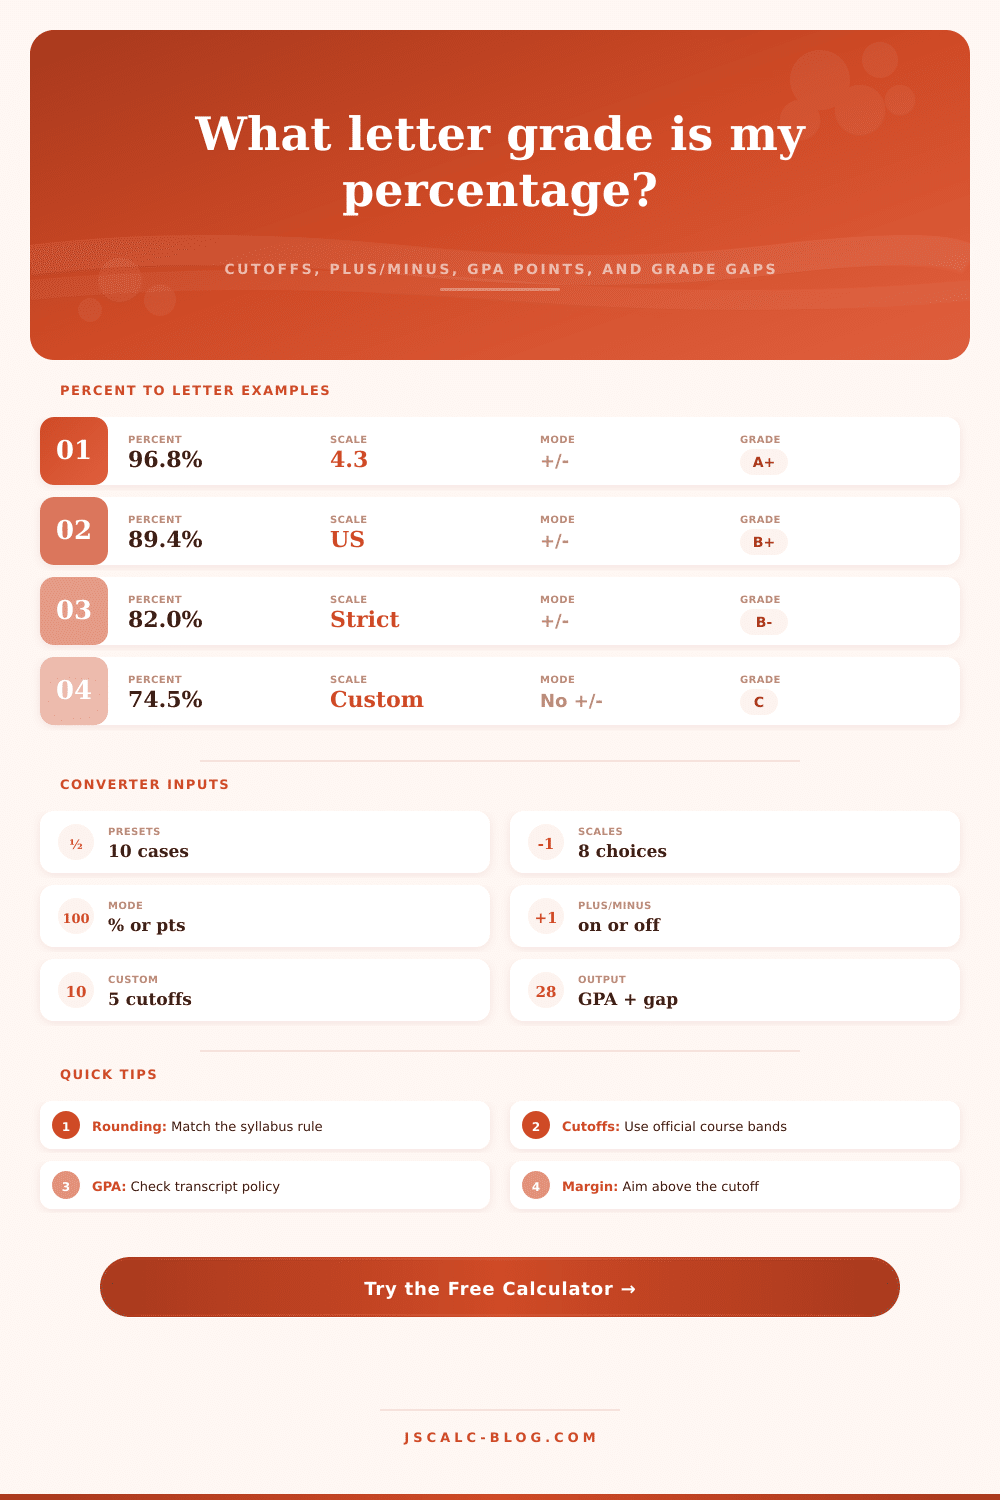
Percentage to Letter Grade Converter
Convert a percentage or points score into a letter grade, plus/minus band, GPA value, cutoff explanation, and margin to the next grade on JSCalc-Blog.com.
Use direct percent for a known grade, or points mode when the score comes from earned points divided by possible points.
This grade is just below the next cutoff; a small rounded-score policy change may matter.
| Scale | A Range | B Range | C Range | D / F Rule |
|---|---|---|---|---|
| US standard | 90.0 to 100 | 80.0 to 89.99 | 70.0 to 79.99 | D starts 60.0 |
| College 4.3 | A+ at 97.0, A at 93.0 | B+ at 87.0 | C+ at 77.0 | D- starts 60.0 |
| Strict honors | A starts 95.0 | B starts 85.0 | C starts 75.0 | D starts 65.0 |
| Lenient classroom | A starts 88.0 | B starts 78.0 | C starts 68.0 | D starts 58.0 |
| Graduate | A starts 93.0 | B starts 83.0 | C starts 73.0 | No D band shown |
| Pass/fail | Pass at cutoff | No B band | No C band | Fail below cutoff |
| Letter | 4.0 GPA | 4.3 GPA | No +/- GPA | Typical Meaning |
|---|---|---|---|---|
| A+ | 4.0 | 4.3 | 4.0 | Exceptional mastery |
| A | 4.0 | 4.0 | 4.0 | Excellent work |
| A- | 3.7 | 3.7 | 4.0 | High achievement |
| B+ | 3.3 | 3.3 | 3.0 | Strong work |
| B | 3.0 | 3.0 | 3.0 | Good work |
| C | 2.0 | 2.0 | 2.0 | Satisfactory |
| D | 1.0 | 1.0 | 1.0 | Minimum credit |
| F | 0.0 | 0.0 | 0.0 | No credit |
| Raw Score | No Rounding | Nearest Tenth | Nearest Whole | Why It Matters |
|---|---|---|---|---|
| 89.94% | 89.94% | 89.9% | 90% | Whole rounding may reach A- |
| 86.96% | 86.96% | 87.0% | 87% | Can cross B+ cutoff |
| 79.95% | 79.95% | 80.0% | 80% | Can cross B- or B |
| 69.49% | 69.49% | 69.5% | 69% | May remain below C- |
| 59.50% | 59.50% | 59.5% | 60% | Whole rounding can pass |
| Conversion Step | Formula | Example | Output |
|---|---|---|---|
| Points to percent | earned / possible x 100 | 134 / 150 x 100 | 89.33% |
| Round score | policy applied before lookup | 89.33 to tenth | 89.3% |
| Find band | highest cutoff not exceeded | 89.3 >= 87 | B+ |
| Next margin | next cutoff - used percent | 90 - 89.3 | 0.7% |
Percent mode: the entered percentage is bounded from 0 to 100, optionally rounded by policy, then compared against the selected cutoff list from highest to lowest.
Points mode: percent = points earned / points possible x 100. The converter then applies the same rounding, cutoff, plus/minus, GPA, and margin logic.
Custom cutoffs: whole-letter cutoffs use your A, B, C, D, and pass values. When plus/minus is on, sub-bands are interpolated inside each whole-letter range.
If you’re in that uncomfortabel range: eighty-nine to ninety percent, you might start getting anxious. That tiny difference is enough to change an A to a B in high school. It can also change a 3.7 to a 3.0 on college applications.
But it’s less about the math then the policy. Professors, departments and even schools has different grading scales. So knowing why these tables exists is what actualy helps you strategize.
Why Grade Rules Change and How to Plan Your Score
The standard scale of 90/80/70/60 isn’t a set-in-stone rule, it’s a flexible norm. Some programs has an A that begins at ninety-five in strict settings; others are more lenient and have an A beginning at eighty-eight. That’s because grading is both measuring and calibrating. By choosing a personal scale, you’re rewriting the rules of the room to match your specific syllabus. A ninety-two percent can be a rock-solid B-plus in one course and barely make an A-minus in another. You don’t want to presume you’re being graded according to same standards that applied in high school.
With this tool, you can change those realities on the fly. Many students forget about plus-minus grade, and this makes things even more complicated. These cut up the normal ten-point scale into even finer increments. For instance, an 86 may seem secure on the B-plus side of things, until you realize it’s just a point away from a B-minus. That seems dangerous indeed. Those little sub-grades is meant to add nuance, but instead just cause confusion.
The converter factors those in and shows you exactly what part of the tier you fall under. It’ll show you how far off you are to the next grade, too, a helpful bit of information for someone on the cusp. If you find out you’re only half a percentage point from moving up a tier, that alters your mindset when preparing for a last minute participation point or paper. What used to be vague anxiety becomes real strategy.
But what about the sneaky little variable called “rounding”? In some grading systems, a raw score of eighty-nine-point-five remains an eighty-nine. Other systems will round it up to a ninety. This isn’t some bug, it’s a policy decision.
Thankfully, the calculator lets you experiment with various rounding policies, and this can be critical when your instructor doesn’t specify her preference. Knowing whether or not she rounds up helps put your mind at ease. Knowing that she truncates means you has to get those additional points. It is a small thing. Yeah, but it still matters.
Look through the reference tables on the page for how various policies impact final letter, but the takeaway is about validation. Don’t presume that the registrar’s office has same rounding logic as your professor’s office.
The GPA translation goes beyond the letter grade. Although letter grades are social signals, GPA points is academic and financial currency. Most colleges follow a four-point scale, though some go to a four-point-three system that gives A-pluses additional points. Other schools don’t acknowledge plus-minuses at all; they lump an A-plus and an A-minus together as a single four-point value. This difference can make a big difference when it comes time to apply to graduate school or for scholarships.
When you select your specific scale and letter, the tool translates them into the correct number, which avoids common mistake of comparing your high school GPA to a college transcript.
In the end though, a grade is just a snapshot. A measurement of performance at one point in time. It’s a helpful way of measuring what you’ve learned but it doesn’t tell the full story. You should of known that.
The converter removes some of the ambiguity from the raw number and shows exactly where you stand based off the rules that apply in this odd situation. It transforms an arbitrary percentage floating out there into a concrete category and a road map to the next step. If you’re looking to defend a GPA or if you’re just curious about a report card, knowing exactly what the cut off is and how far you have to go to get to the next level empowers you to make plans.
Yes, you don’t get to control the teacher’s rubric but you do get to control your preparation for it. And that’s the true value of putting the numbers in their proper place.