Operating Leverage Calculator
Estimate degree of operating leverage from unit margin, fixed operating expenses, current volume, and a planned sales change. The calculator reports contribution margin, operating income sensitivity, break-even volume, and margin of safety.
🎯Operating Leverage Presets
🧮Leverage Inputs
The reference changes benchmark wording, not your arithmetic.
Currency is display-only; formulas stay the same.
Use average revenue per subscription, meal, order, room night, or ticket.
Include unit-linked processing, materials, labor, commissions, and fulfillment.
Rent, salaries, platform, depreciation, and overhead for the same period.
Use paid accounts, meals, widgets, room nights, orders, or tickets.
Enter percent change in units, such as 10 for growth or -8 for decline.
Use this for a step-up lease, hiring plan, or temporary overhead reduction.
Optional after-tax sensitivity view; DOL itself uses operating income.
Cushion shows a more conservative break-even target volume.
🔢Current Operating Snapshot
📊Business Model Reference Grid
📝Scenario Comparison Table
| Scenario | Price | Variable Expense | Fixed Expenses | Units | CM Ratio | DOL | Break-even Units | Read |
|---|---|---|---|---|---|---|---|---|
| SaaS subscription base | 49 | 9 | 180,000 | 6,200 | 81.6% | 3.65x | 4,500 | High upside after fixed base |
| Restaurant lunch shift | 18 | 7.50 | 38,000 | 4,600 | 58.3% | 4.74x | 3,620 | Labor and rent amplify volume |
| Factory capacity run | 125 | 72 | 260,000 | 6,400 | 42.4% | 4.32x | 4,906 | Heavy fixed capacity base |
| Retail store month | 64 | 39 | 52,000 | 3,100 | 39.1% | 3.04x | 2,080 | Moderate store leverage |
| Agency retainer mix | 3200 | 1400 | 85,000 | 70 | 56.3% | 3.07x | 48 | Staff utilization drives swing |
| Hotel room nights | 155 | 36 | 310,000 | 3,300 | 76.8% | 4.73x | 2,606 | Occupancy is powerful |
| Gym membership ramp | 42 | 6 | 72,000 | 2,650 | 85.7% | 4.04x | 2,000 | Fixed facility leverage |
| Event ticket scenario | 85 | 28 | 110,000 | 2,400 | 67.1% | 5.08x | 1,930 | Close to venue break-even |
| Near break-even startup | 39 | 8 | 210,000 | 7,050 | 79.5% | 24.41x | 6,775 | Small sales miss can erase income |
🧭DOL Interpretation Reference
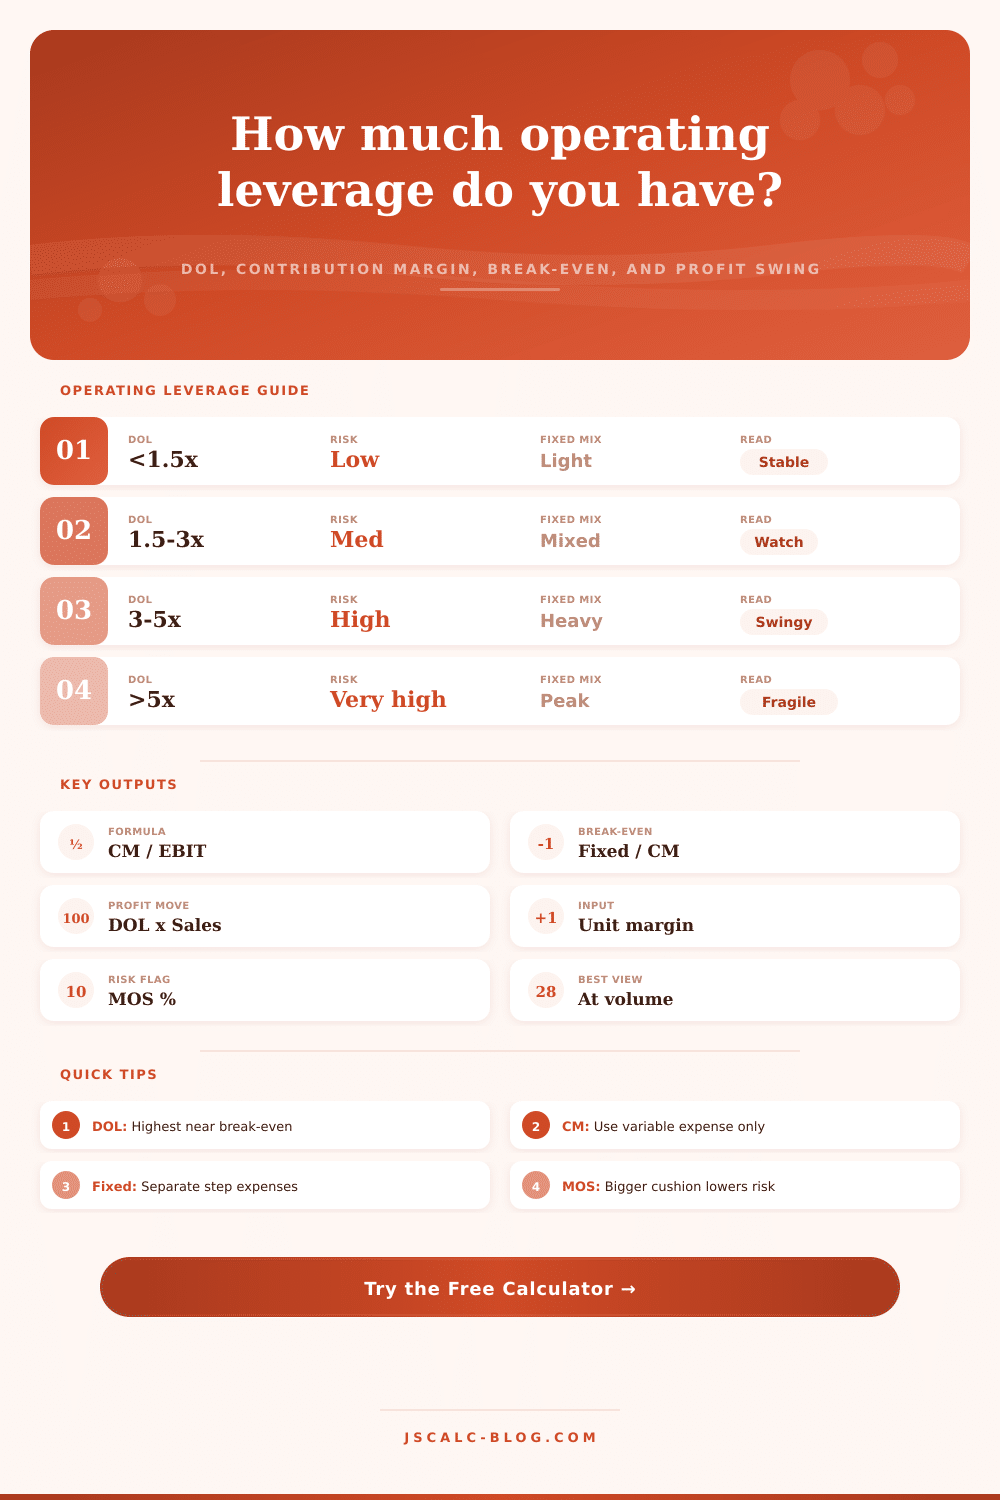
| DOL Range | Operating Pattern | Profit Sensitivity | Planning Meaning | Next Check |
|---|---|---|---|---|
| Below 1.0x | Loss or unusual mix | Not meaningful | Operating income is at or below zero | Fix break-even first |
| 1.0x to 1.5x | Low fixed expense base | Small profit swing | Variable structure absorbs volume changes | Review margin quality |
| 1.5x to 3.0x | Balanced structure | Moderate swing | Growth helps, decline hurts, but cushion exists | Track fixed additions |
| 3.0x to 5.0x | High fixed expense base | Large profit swing | Sales changes strongly affect operating income | Stress-test demand |
| 5.0x to 10.0x | Very close to break-even | Very large swing | Small unit changes may dominate the plan | Raise margin of safety |
| Above 10.0x | Break-even edge | Extreme swing | DOL is mathematically unstable near zero income | Use scenario table |
⚖Contribution Margin Benchmarks
| Business Model | Typical CM Ratio | Fixed Mix | Leverage Pattern | Common Watch Item |
|---|---|---|---|---|
| SaaS or digital subscription | 70% to 90% | High | High DOL after platform build | Churn and support load |
| Restaurant or food service | 45% to 65% | Medium | Shift-level leverage | Labor scheduling |
| Manufacturing line | 25% to 50% | High | Capacity leverage | Utilization and scrap |
| Retail storefront | 30% to 55% | Medium | Traffic and basket leverage | Markdowns and returns |
| Service agency | 35% to 65% | Medium | Utilization leverage | Billable capacity |
| Hotel or room nights | 60% to 85% | High | Occupancy leverage | Seasonality |
| Fitness membership | 70% to 90% | High | Member ramp leverage | Retention and capacity |
| Event or ticketed venue | 55% to 80% | High | Attendance leverage | Minimum attendance |
🔍Formula and Method
💡Operating Leverage Tips
Most entrepreneurs think that “sales” means the same thing as “profit.” They obsess over revenue but ignore their cost structure. If they gets a 10% boost in sales, do they gain a 10% increase in profit?
Answer: sometimes yes; sometimes no. Sometimes they double their profit. And sometimes they don’t make any extra money at all.
What is Operating Leverage?
Why? Because of operating leverage, i.e., the math underlying your cost structure and how much that influence your bottom line. Knowing this isn’t just accounting. It’s survival.
Fixed vs. Variable: Operating leverage refers to what percent of your cost is variable versus fixed. Variable costs are expenses associated with each unit sold, such as credit card fees, shipping, or other raw material expenses. For example, if you sell 10 units this month, these expenses will only be $200.
Fixed costs is expenses you pay regardless of whether you sell anything today, such as software subscriptions, salaries, and rent. For example, even if you don’t sell anything this month, you still need to pay these expenses.
High operating leverage = High Fixed / Low Variable: In other words, you have high operating leverage if you have a high contribution margin per unit. Every additional unit flow almost entirely to the bottom line after paying down fixed base. You can put it another way: If sales go up by one percent, how much does operating income change?
The calculator above takes your fixed overhead, variable expenses, and price. Then spits out your operating leverage ratio. This ratio indicates how sensitive your operating income is to changes in sales volume. How much your operating income rise for an increase of 1% in sales volume).
Let’s say you have a choice between starting a custom carpentry shop or a software company. Your carpentry shop has cheap rent, but must spends money on lumber and labor to produce each table.
In contrast, your software business has big expenses in development up front (and server bills), but can add one more user without spending any extra money. Your software business has a lot of debt. When it sells more, its profits multiply wildly, the fixed costs are already covered! When it slows down, those fixed bills hit hard and profits drys up fast.
Your carpentry business is not very leveraged at all. As it makes more sales, profit increase at the same rate. It doesn’t make much money per table but it softens the blow when times are tough.
There’s no right-or-wrong here; just the right fit for your risk tolerance. When evaluating these numbers, consider margin of safety. That is the distance between where you’re currently selling and your break-even point. The wider the margin of safety, the better for high leverage model.
The closer to break even you operate, the higher your operating leverage ratio. It looks nice but a slight drop in demand destroys all of your profits. As you can see from table on this page, the closer you get to that line, the more risky it is. Founders often mistake a high leverage ratio for a healthy business, it’s really just a fragile one without guaranteed volume.
You need good data to use this tool. Tally your expenses separately and don’t mask variable ones… E.g., packaging and commissions; among your fixed overhead. They go into the variable column, because they vary along with volume.
Likewise, don’t overlook your step-fixed expenses, e.g., hiring a new manager once your revenue reach a certain level. Such mixed costs skews your results.
For your future plans, enter the volume change that you expect, and observe impact on your operating income. That’s your sensitivity analysis; it will tell you if the plan depends upon perfect execution or can withstand some errors.
But operating leverage cuts both ways: it increases gains as well as amplifying losses. Where do you fall on that leveraged scale? You could of changed your biz model overnight, but know where you stand.
Is your game one of margins, where efficiency prevails, or volume, where consistency rules? Knowing your leverage tells you when to trim fixed cost (lowering the break-even hurdle) vs. Invest in marketing to drive more volume.
The math is straightforward. But the impact is huge. Once you master that pattern, blind optimism becomes planned strategy. Instead of guessing how many you need to sell, you’ll know exactly how your structure either protects OR exposes you to changes in the market.