Fixed Cost Allocation Calculator
Allocate rent, salaries, depreciation, shared services, insurance, and other fixed overhead to a department, product line, site, or client using a practical driver such as labor hours, machine hours, square footage, headcount, units, revenue share, equal split, or activity score.
🎯Allocation Presets
🧮Fixed Pool and Driver Inputs
This labels the output and interpretation.
Choose the driver that best reflects use of fixed capacity.
The calculator also shows the monthly equivalent.
Rounding applies to displayed allocation dollars.
Examples: lease, salaried supervision, base utilities.
Examples: HR, IT, compliance, scheduling, admin.
Examples: equipment depreciation, insurance, facility burden.
Optional visible reserve for fixed commitments and timing gaps.
Direct labor hours used by the target.
Direct labor hours used by all targets in the same period.
Use products, service units, visits, orders, or billable deliverables.
Optional denominator for fully loaded cost and burden percent.
🔢Current Allocation Snapshot
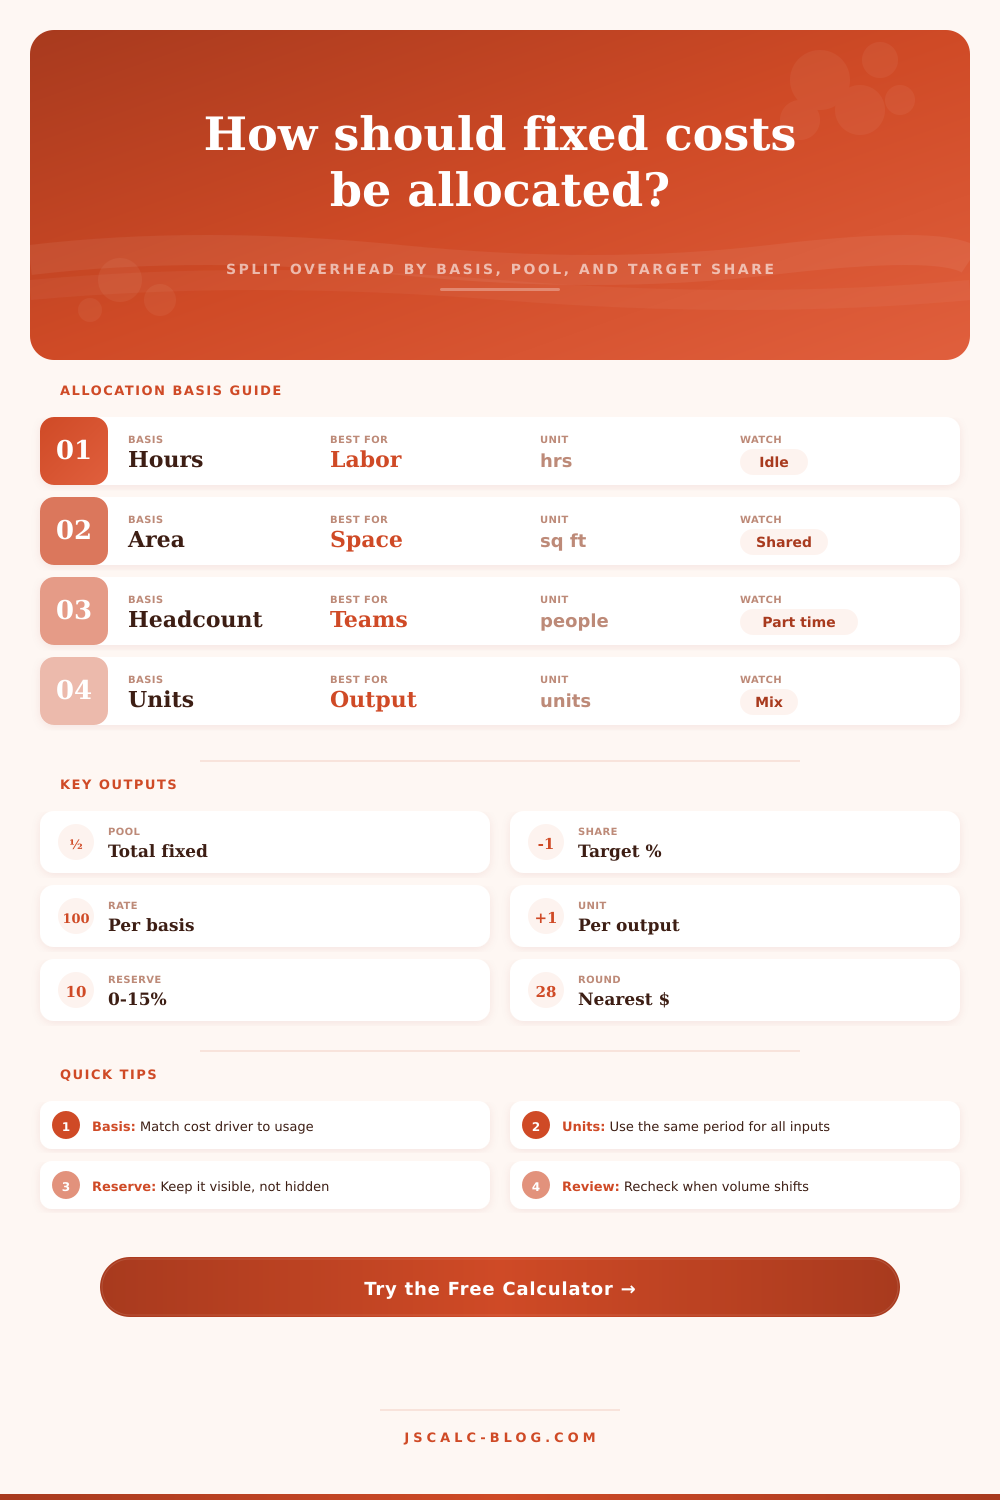
📘Allocation Basis Reference
| Basis | Primary Driver | Best Use | Formula Share | Common Watchout |
|---|---|---|---|---|
| Direct labor hours | Human time | Supervision, payroll support, training burden | Target hours / total hours | Idle time can distort the pool |
| Machine hours | Equipment time | Depreciation, maintenance, factory lease burden | Target machine hours / total machine hours | Setup-heavy work may need a second driver |
| Square footage | Occupied area | Rent, insurance, utilities, security, cleaning | Target area / total area | Shared corridors and storage need policy treatment |
| Headcount | People assigned | HR, office services, management, software seats | Target people / total people | Part-time or seasonal staff may need FTE conversion |
| Units produced | Output volume | Standard production overhead and batch reporting | Target units / total units | Complex products can absorb too little overhead |
| Revenue share | Sales dollars | Executive overhead, brand support, account coverage | Target revenue / total revenue | High-margin and low-margin work may be mixed |
| Equal share | Target count | Locations, departments, identical programs | 1 / target count | Useful only when units are reasonably comparable |
| Activity score | Weighted usage | Mixed work where tickets, visits, hours, and complexity differ | Target score / total score | Weights should be documented and reviewed |
🧱Driver Profile Grid
📋Preset Scenario Reference
| Scenario | Target | Basis | Pool Before Reserve | Target / Total | Output Units | Reserve | Why This Basis Fits |
|---|---|---|---|---|---|---|---|
| Machine shop hours | Product line | Machine hours | $118,000 | 920 / 4,850 | 7,600 | 4% | Equipment time drives depreciation and facility burden |
| Warehouse square feet | Branch zone | Square footage | $74,000 | 18,500 / 62,000 | 41,000 | 6% | Space usage drives rent, utilities, and security |
| Consulting headcount | Practice team | Headcount | $96,500 | 14 / 58 | 2,240 | 3% | People support burden follows staff assigned |
| SaaS support seats | Product group | Activity score | $142,000 | 2,450 / 8,900 | 31,500 | 5% | Weighted tickets and seats better than raw headcount |
| Clinic room hours | Service line | Labor hours | $88,500 | 1,120 / 4,200 | 1,860 | 7% | Room coverage and staff time move together |
| Cafe equal locations | One location | Equal share | $51,000 | 1 / 6 | 9,800 | 2% | Locations have similar footprint and operating hours |
| Print run units | Batch | Units produced | $63,000 | 24,000 / 138,000 | 24,000 | 4% | Standard overhead is absorbed by production volume |
| Studio revenue share | Client account | Revenue share | $119,000 | 86,000 / 410,000 | 460 | 5% | Commercial support follows account revenue load |
| Lab activity score | Research program | Activity score | $156,000 | 340 / 1,125 | 980 | 8% | Weighted score blends bench hours and equipment intensity |
⚖Formula and Method Breakdown
🔍Allocation Quality Checks
| Check | Good Sign | Risk Sign | Action | Calculator Field |
|---|---|---|---|---|
| Same period | Pool and driver both monthly, quarterly, or annual | Annual pool with monthly hours | Normalize inputs before entry | Reporting period |
| Driver fit | Basis explains why fixed capacity is used | Convenient data, weak relationship | Switch basis or split the pool | Allocation basis |
| Total basis | Total includes every target sharing the pool | Only active or favored units included | Audit denominator coverage | Total basis units |
| Target basis | Target units are measured consistently | Estimated with a different definition | Document source and cutover date | Target basis units |
| Reserve visibility | Buffer is shown as a separate percent | Hidden in one overhead line | Keep reserve policy explicit | Planning reserve |
| Output absorption | Output units reflect usable units or delivered work | Includes scrap, rework, or cancelled work | Use the unit definition from reporting | Target output units |
💡Practical Allocation Tips
Where does your business spend its money? When it doesn’t buy a product, then you should figure out where it needs to lose money.
For example: Fixed costs is like the heavy furnitures of a company. These include salaries, depreciation, insurance, rent, and more. Whether you make one sale or ten thousand, those cost don’t change. And here’s the issue: you have no idea what they are. What product line pay for those? If you’re guessing about this stuff, then you’ll end up pricing your successful products to high, and your losers too cheaply. You’ll go broke.
How to Calculate Fixed Costs
Second, you must decide what the driver is. What’s the thing that eats up the resource? Warehouse rent are a good driver for square footage. IT support costs is usually best driven by headcount. Check out this reference table to help you match typical drivers to when they is most useful.
Don’t select the easiest-to-count number. Select the number that actualy represents your use of it. Allocating equipment depreciation to sales revenue doesn’t show how much each product actualy uses machines. It obscures your cost picture.
Next up, create the pool. The pool is the entire amount of fixed money to be allocated. Smart operators includes a buffer called a planning reserve. Five to ten percent of base overhead is added as a planning reserve. Use it as a buffer in case of unexpected fixed commitments or timing gaps.
To calculate an adjusted total, use a calculator to combine base overhead, facility burdens, and shared services. Split the adjusted total, not merely the raw lease payment. Putting the reserve into the base calculation upfront makes your allocation honest; otherwise you’ll be surprised when you discover that overhead didn’t covered the bill.
Here’s where things get split up: How many hours of use do a certain client contract, product line, or department represents? Divide those and see what fraction they represent in terms of hours used. For example, if 200 of a thousand machine hours are on one product line, then it represent twenty percent of the pool. That becomes your allocation rate.
Your rate will tell you precisely how much each unit or hour is carrying as a fixed cost. Now divide your allocated cost by your units produced, and there’s your fixed cost per item. That’s what goes into pricing. Guessing at your break-even point wouldn’t of cut it.
This one traps a lot of manager. Fixed costs are constant, they think. Nope. The fixed cost per output change with volume. The more units produced, the lower the fixed cost per unit. The fewer units produced, the higher the fixed cost per unit. Producing half as many widgets? Your fixed cost will double.
Want to know whether you’re allocating correcty? Put the numbers into a calculator. Compare what you allocate to the number of equal shares. That will tell you if you’ve taken a lazy way of splitting up the burden in equal shares. It will also show if your allocation reflect each item’s ability to pull its own weight. Only when all units are exactly alike do equal shares make sense. And in the real world, that almost never happens. One order may require three times as much setup as another, but an equal share assume both orders use equally complex resources.
Look at what determines the allocation. Last, consider what it actualy costs to make that thing: the fully loaded cost. That’s direct cost plus amount of fixed overhead you’ve assigned yourself. If you’re spending $50 on direct cost, but adding an extra $20 via your fixed allocation, then you must charge over $70 to cover all those expenses and remain solvent.
The burden rate also reveals just how much fixed costs eat up your direct spend. Is there room to maneuver? Or are you livig with a high burden, meaning that your fixed overhead is consuming your margin? All of this will help you turn overhead from “mystery” into “management tool.” You’ll go from being afraid of fixed overhead, to driving it. Your objective isn’t to know who pays for overhead; your objective is to know who pays for overhead.