Margin of Safety Calculator
Estimate the discount between a security's market price and your conservative fair value. The calculator applies a confidence haircut, compares the current price with your target buy price, and reports upside, downside buffer, position exposure, and decision wording.
🎯Margin of Safety Presets
🧮Valuation Inputs
Currency changes labels only; formulas use the values entered.
The context sets the reference guidance shown in the breakdown.
Enter the quote or purchase price you want to test.
Use your conservative appraisal before any extra haircut.
The adjusted fair value equals fair value multiplied by 1 minus this haircut.
Target buy price equals adjusted fair value times 1 minus this target.
Used for position exposure and portfolio-level upside or gap values.
Optional, but useful for checking whether the idea is becoming too large.
A stress value or liquidation estimate for downside review.
Annualized upside assumes price converges to adjusted fair value by this period.
🔢Current Safety Snapshot
📋Reference Margin Levels
| Margin of Safety | Price vs Adjusted Fair Value | Typical Reading | Common Use | Main Risk |
|---|---|---|---|---|
| Negative | Above adjusted fair value | Over fair value on your numbers | Avoid, trim, or wait | Optimistic value estimate |
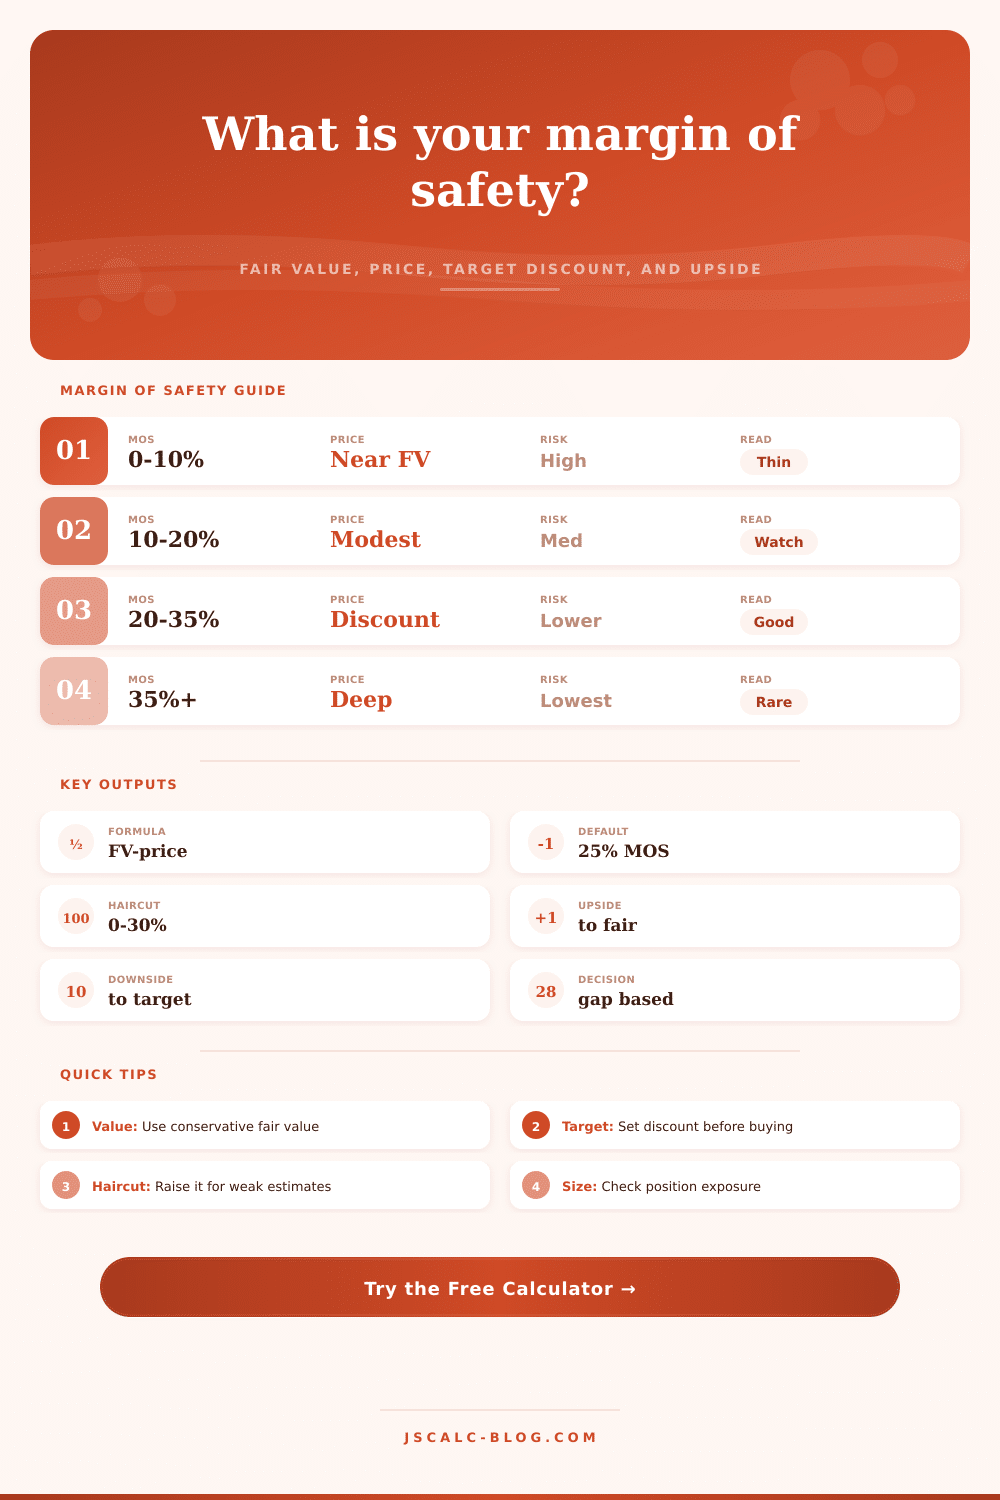
| 0% to 10% | Very close to fair value | Thin safety cushion | Quality names only | Small estimate error removes upside |
| 10% to 20% | Modest discount | Useful watchlist zone | Stable assets or funds | May not cover business volatility |
| 20% to 35% | Meaningful discount | Common value-investing target | Individual stocks with normal uncertainty | Value trap if fair value is wrong |
| 35% to 50% | Deep discount | Large valuation gap | Cyclical, small-cap, or messy cases | Business deterioration may explain gap |
| Above 50% | Extreme discount | Rare or distressed setup | Special situations only | Fair value may be stale or impaired |
🧭Asset Context Safety Guide
| Context | Starter MOS | Useful Fair Value Anchor | Confidence Haircut | Position Check | Common Watchout |
|---|---|---|---|---|---|
| Quality operating business | 15% to 25% | DCF, owner earnings, normalized multiple | 5% to 15% | Can be larger if balance sheet is strong | Overpaying for quality |
| Cyclical or commodity business | 30% to 50% | Mid-cycle earnings or asset value | 15% to 30% | Keep room for cycle timing errors | Peak earnings look cheap |
| Turnaround or restructuring | 35% to 50% | Sum-of-parts or post-repair earnings | 20% to 30% | Size smaller until execution improves | Recovery takes longer than expected |
| Bank, insurer, or financial | 20% to 35% | Tangible book, ROE, loss-adjusted earnings | 10% to 25% | Review leverage and capital quality | Hidden credit or duration risk |
| REIT or real asset vehicle | 15% to 30% | NAV, cap-rate value, AFFO multiple | 10% to 20% | Debt maturity schedule matters | Rate changes hit value and funding |
| ETF, fund, or NAV screen | 0% to 10% | Published NAV or index value | 0% to 5% | Usually diversified exposure | Discount may track fees or liquidity |
| Early-stage growth company | 40% to 60% | Scenario-weighted future cash flow | 25% to 40% | Limit size because range is wide | Terminal assumptions dominate |
| Bond or preferred security | 5% to 20% | Par value, yield spread, credit recovery | 5% to 20% | Focus on issuer concentration | Credit loss can overwhelm yield |
📐Price Gap Quick Lookup
| Adjusted Fair Value | 10% MOS Price | 20% MOS Price | 30% MOS Price | 40% MOS Price | 50% MOS Price |
|---|---|---|---|---|---|
| $25.00 | $22.50 | $20.00 | $17.50 | $15.00 | $12.50 |
| $50.00 | $45.00 | $40.00 | $35.00 | $30.00 | $25.00 |
| $75.00 | $67.50 | $60.00 | $52.50 | $45.00 | $37.50 |
| $100.00 | $90.00 | $80.00 | $70.00 | $60.00 | $50.00 |
| $150.00 | $135.00 | $120.00 | $105.00 | $90.00 | $75.00 |
| $250.00 | $225.00 | $200.00 | $175.00 | $150.00 | $125.00 |
| $500.00 | $450.00 | $400.00 | $350.00 | $300.00 | $250.00 |
⚙Formula Method
💡Margin of Safety Tips
When you look at a stock whose price appears to be a steal, your heart begin to race towards the “buy” button, it’s an instinctive reaction. But it’s dangerous. Because what matter is what you’re willing to pay; the market doesn’t care if you think its a great deal.
This is where the idea of having a margin of safety come into play. And it’s not just a number. It’s a safety buffer against your own errors. There’s no way around it: you will make error, and your assumptions will be wrong.
Why You Need a Margin of Safety
When you do this yourself, you’ll need to guess whether the discount is truly protective or just optimistic. Plug your confidence level and fair value into calculator, and it’ll do the math for you. You won’t have to guess anymore.
That’s the basic premise: Guess at a business’ value. Step away from it. And then guess again, how far off can you possibly be? If, for instance, you believe a company to be worth a hundred bucks, yet you’re correct just 80% of the time, you shouldn’t of buy the business for a hundred bucks. You ought to pay less; the gap between what you paid and what you expected is your margin of safety.
This is what protect you against unpleasant surprises: bad news, accounting trickery, unforeseen competition. With a safety net, you’re playing the game of being approximately correct; without it, you’re wagering on perfection. The difference is bigger then nearly everything.
Remember: Fair value is the entry point. But it’s also the most perilous. Discounted cash flow sounds so precise. “I’m projecting these earnings five years from now; I’ll discount them back to today, and…” It sounds authoritative. It feels authoritative. But numbers are delicate. A tiny tweak in the discount rate or the growth rate can send the number careening off-course.
And here’s where the confidence haircut kick in. This makes you acknowledge your uncertainty. If you’re valuing a solid utility business, perhaps all you need is a small discount. If you’re valuing a cyclical commodity business, or a turnaround play, then you’d better bring out the scissors for a big-time cutdown.
The tool helps you visualize this trade-off by adjusting the fair value downward before comparing it to market price, and reminds you that accurate isn’t necessarily the same as precise. So now that you’ve got your adjusted value, what’s your target? How big a discount are you comfortabley with?
Many value investor use 20% as the floor, and you may want 30% or even 40% for riskier investments. Depending on your comfort level, the calculator display your target buy price and shows you both the upside if you are right and the downside if you are wrong. Having both perspectives is key.
Most people see just the potential gain and overlook the harm that can result from a failed thesis. This check on position size relative to your overall portfolio value will protect you from concentration risk. You may get a terrific margin of safety on one stock, but too large a purchase can transform a valuation mistake into a portfolio disaster.
As you’ll see from the reference tables on the page, early stage growth businesses is subject to a bigger discount than other types of assets (unlike ETFs and bonds). That’s logical: we don’t know what the future holds for growth stocks but we do know what our bonds will pay us. Discounting them by the same amount is a mistake, as it mixes up uncertainty with uniformity. It isn’t uniform.
And this isn’t about finding the largest number; it’s about identifying the one that reflect the reality of the business in question. It’s less about predicting the future and more about preparing for it. It’s about hedging.
You’ll never have perfect knowledge of when a stock will be at fair value. You may not know whether or not you were even close. What you can control is the price you pay. You can insist on a discount that protects you in case you’re wrong. That’s the entire game.
The discipline is most important; the math comes second. Walking away from a deal because the price is bad isn’t missing out, it’s protecting yourself. Survival is the only measure that matters in the long run.