Net Worth Percentile by Age Calculator
Add up your household assets and debts to see your net worth, then rank it against US peers in your age bracket using Federal Reserve Survey of Consumer Finances (SCF 2022) distribution data.
🎯Real Household Presets
📝Age, Assets & Debts
Sets the SCF age bracket used for ranking.
Home value minus what you still owe.
Student loans, credit cards, auto, and other balances.
🔢How the Percentile Is Built
⚖Formula Breakdown
📊SCF 2022 Net Worth by Age Bracket
| Age Bracket | 10th | 25th | 50th (Median) | 75th | 90th | 99th |
|---|---|---|---|---|---|---|
| Under 35 | -$5,400 | $3,900 | $39,000 | $121,000 | $250,000 | $1,600,000 |
| 35 to 44 | $1,000 | $28,000 | $135,000 | $375,000 | $660,000 | $3,600,000 |
| 45 to 54 | $3,200 | $52,000 | $247,000 | $680,000 | $1,300,000 | $6,500,000 |
| 55 to 64 | $5,600 | $78,000 | $364,000 | $980,000 | $1,900,000 | $9,100,000 |
| 65 to 74 | $14,000 | $110,000 | $410,000 | $1,150,000 | $2,600,000 | $10,500,000 |
| 75 and up | $18,000 | $97,000 | $335,000 | $860,000 | $1,800,000 | $7,200,000 |
| All ages | $0 | $27,000 | $192,000 | $660,000 | $1,900,000 | $16,700,000 |
💵Median vs Mean Net Worth by Age
| Age Bracket | Median Net Worth | Mean Net Worth | Mean / Median Skew |
|---|---|---|---|
| Under 35 | $39,000 | $183,500 | 4.7x |
| 35 to 44 | $135,600 | $549,600 | 4.1x |
| 45 to 54 | $247,200 | $975,800 | 3.9x |
| 55 to 64 | $364,500 | $1,566,900 | 4.3x |
| 65 to 74 | $409,900 | $1,794,600 | 4.4x |
| 75 and up | $335,600 | $1,624,100 | 4.8x |
🧩Net Worth Milestone Targets
| Milestone | Meaning | Rough US Threshold | Who Reaches It |
|---|---|---|---|
| Positive net worth | Assets exceed debts | $0 and above | Around 90% of households |
| National median | Middle of all households | $192,000 | Top 50% |
| Comfortable | Solid cushion | $660,000 | Top 25% |
| Affluent | Top decile | $1,900,000 | Top 10% |
| Wealthy | Near the top | $16,700,000 | Top 1% |
📈Percentile Comparison Grid
| Age Bracket | 25th Pctile | 50th Pctile | 75th Pctile | 90th Pctile | 99th Pctile |
|---|---|---|---|---|---|
| Under 35 | $3,900 | $39,000 | $121,000 | $250,000 | $1,600,000 |
| 35 to 44 | $28,000 | $135,000 | $375,000 | $660,000 | $3,600,000 |
| 45 to 54 | $52,000 | $247,000 | $680,000 | $1,300,000 | $6,500,000 |
| 55 to 64 | $78,000 | $364,000 | $980,000 | $1,900,000 | $9,100,000 |
| 65 to 74 | $110,000 | $410,000 | $1,150,000 | $2,600,000 | $10,500,000 |
| 75 and up | $97,000 | $335,000 | $860,000 | $1,800,000 | $7,200,000 |
🎯Asset-Mix Benchmarks
| Asset Class | Share of Median Household | Notes |
|---|---|---|
| Home equity | Around 45% | Largest asset for most middle-wealth families |
| Retirement accounts | Around 25% | 401(k), IRA, and pension balances |
| Cash and savings | Around 10% | Checking, savings, and money market |
| Taxable investments | Around 12% | Brokerage, stocks, and bonds |
| Vehicles and other | Around 8% | Cars, business interests, valuables |
💡Wealth-Building Tips
When you open up your bank account and see that you’re falling behind, it’s easy to get nervous. That’s what affects so many people: They read these stories of millionaires who invested early on, and freak out.
In reality, it’s easier than that. You don’t have to beat some arbitrary finish line. Your net worth is a marathon, and your place in the lineup is far more important then how fast you run compared to other people.
How to Check Your Net Worth by Age
This calculator cuts through the noise. It measures your household’s finances against other households of your precise age group. It relies on actual Federal Reserve statistics instead of viral internet averages.
Everyone gets tripped up by the national median, which they measure themselves against in early years of work. But that number is pulled up by older households with decades of compound interest. It’s a terrible benchmark and destined to make you frustrated. A sixty-eight year old with a four-decades-long accumulation of assets lives in a different world from a twenty-seven year old graduate saddled with student loans.
You want to know if you’re doing okay compared to other people in your age group. That is the only relevant benchmark, and that is what tool will do for you. It’ll put you in company of similar households, meaning households whose head is in the same decade of life as yours, and it’ll tell you where you rank nationally.
How does it work? Simple math, but it helps if people are honest. On one side, list your assets: cash reserves, taxable investment accounts, retirement accounts and home equity., your home’s equity. On the other, list any liabilities: outstanding student loans, car loans, credit card balances, etc. Remember: The mortgage balance has already been deducted from the house’s value, so just plug in how much equity you have. (This avoids double-counting, and keeps total neat.)
If you end up in the red, don’t freak out. Many young pros build up housing/education expenses before they’ve had time to appreciate; it’s normal for their net worth to be negative during this period. It means nothing more than “you owe more than you own,” a temporary situation rather than a lifelong flaw.
Most wealth belongs to a tiny percentage of households, so the distribution is very skewed. That skews averages, which aren’t good guidance for average families anyway. To adjust for that, the calculator fills in gaps between data points using a log scale. What does that mean in practice? It means it considers the gap between $50k and $100k to be roughly the same as the gap between $500k and $1 million, if you’re trying to guess your percentile ranking. That way, you get a smooth but accurate depiction of where you fit into things, without exaggerating small differences or smearing out large ones.
You want to find your neighborhood within the data; not an exact pin on a map.
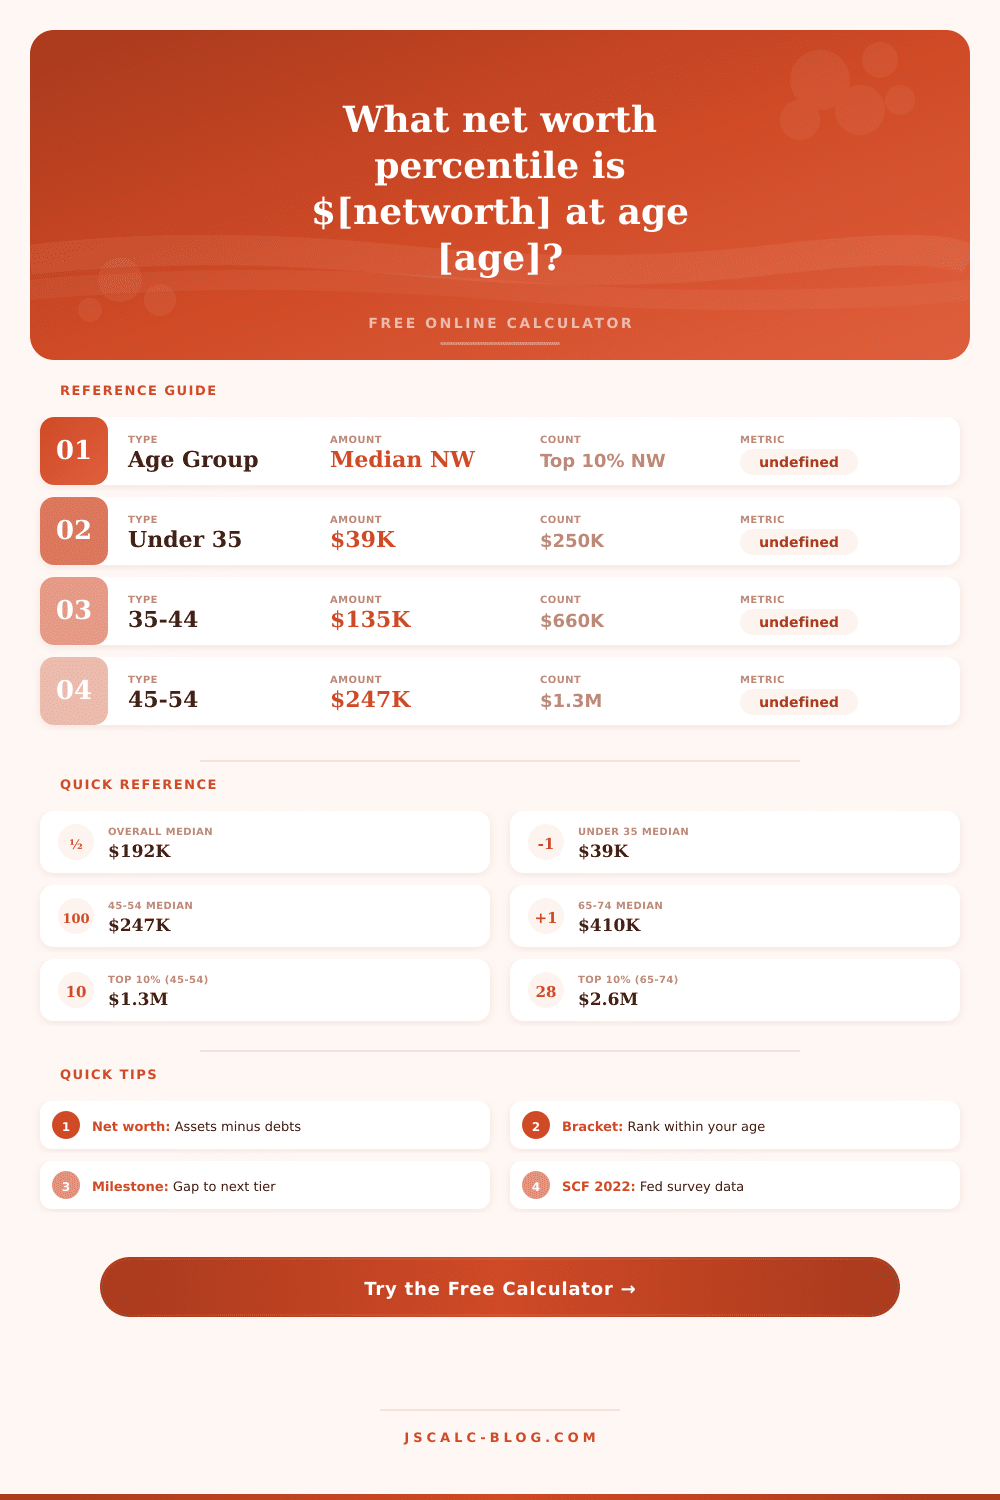
These percentiles change our thinking about goal-setting. What’s the national median? Around a hundred and ninety-two thousand bucks. But who cares? If you’re twenty-five-years-old, that’s irrelevant. The median in the under-thirty-five group hovers around thirty-nine thousand. That’s the amount that puts you ahead of half your peers.
Naturaly, the benchmarks increase over time. In your fifties, the median jumps to something like two hundred forty-seven thousand. You can use those as real measures for progress. Rather than chasing some arbitrary six-figure benchmark, aim to hit the next percentile in your age range. It’s a way to turn abstract money into small achievements.
In the long term, building wealth depends heavily on how you divide your assets. For middle-income families, the bulk of their net worth is likely in home equity (with retirement accounts being second and taxable investments third). Your cash will be stable, but it won’t scale up as quickly as it would if you shift some new savings into compounding investment tools. This tend to accelerate your percentile jump compared to just topping off your checking account.
The calculator tells you how many dollars away you are from the next percentile, which helps you focus your yearly contributions on something tangible. You don’t have to race past other people; you’re only racing yourself, making sure you stay on the right track for where you are in life.
Lastly, keep in mind that averages can be deceptive. A few ultra-rich people pull up the average net worth. This means the mean is 3x, 4x higher than the median. If you’re comfortabley situated with your peer group but compare yourself to the mean, you’ll almost always feel poor. Instead, focus on the median and your percentile rank. That’s what reflects the experience of typical household… Not the outliers at the very top.
Plug your numbers into equation to find out where you stand. Use that information to guide your debt payoff strategy or savings rate. You want to make steady progress in your own lane. Don’t frantically sprint past people who got there years ahead of time.