IQ Percentile Calculator
Turn an IQ score into its percentile rank, z-score, rarity as 1 in N people, and classification band on the Wechsler SD 15, Stanford-Binet SD 16, or Cattell SD 24 scale, assuming a normal distribution with mean 100.
🎯Real IQ Presets
📝IQ Inputs
Mean is fixed at 100 for all scales.
Used when mode is percentile to IQ.
Applies only when scale is set to Custom SD.
Estimates how many people share or exceed the score.
🔢Formula Snapshot
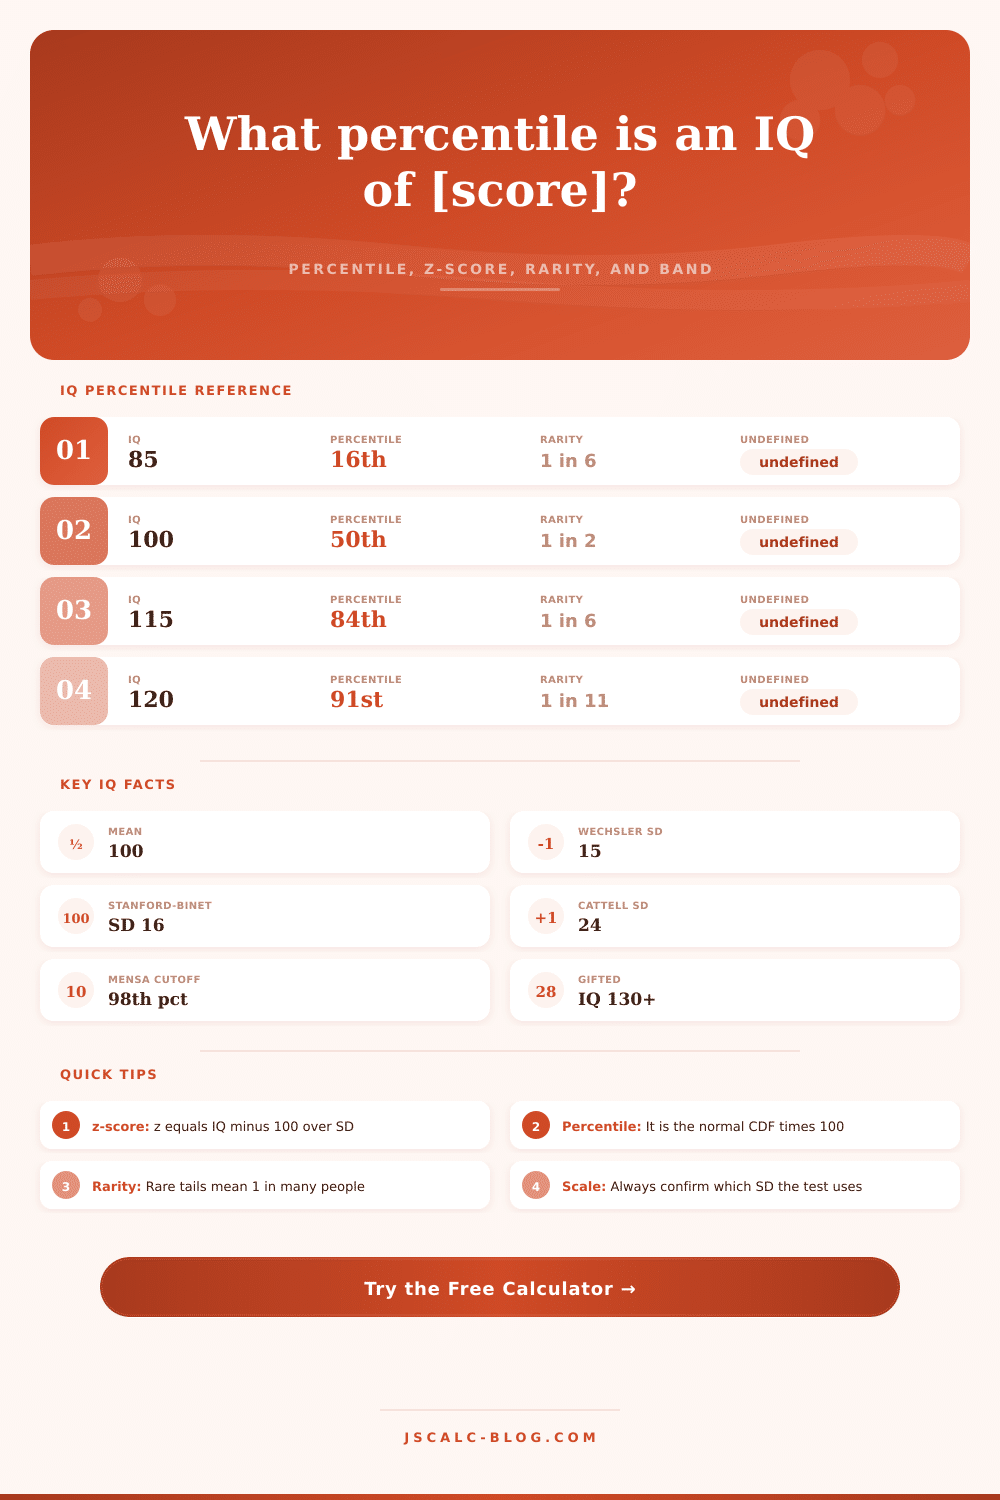
📊IQ to Percentile Lookup (SD 15)
| IQ Score | Z-score | Percentile | Rarity (at or above) | Band |
|---|---|---|---|---|
| 55 | -3.00 | 0.13th | Nearly everyone above | Extremely Low |
| 70 | -2.00 | 2.28th | 1 in 1 (common) | Borderline |
| 85 | -1.00 | 15.87th | 1 in 1 (common) | Low Average |
| 100 | 0.00 | 50.00th | 1 in 2 | Average |
| 115 | +1.00 | 84.13th | 1 in 6 | High Average |
| 120 | +1.33 | 90.88th | 1 in 11 | Superior |
| 130 | +2.00 | 97.72th | 1 in 44 | Very Superior / Gifted |
| 145 | +3.00 | 99.87th | 1 in 741 | Highly Gifted |
| 160 | +4.00 | 99.997th | 1 in 31,560 | Profoundly Gifted |
🏷Classification Bands (SD 15)
| IQ Range | Classification | Approx. Percentile | Population Share |
|---|---|---|---|
| 130 and above | Very Superior / Gifted | 98th and up | About 2.2% |
| 120 - 129 | Superior | 91st - 97th | About 6.7% |
| 110 - 119 | High Average | 75th - 90th | About 16.1% |
| 90 - 109 | Average | 25th - 73rd | About 49.5% |
| 80 - 89 | Low Average | 9th - 23rd | About 16.1% |
| 70 - 79 | Borderline | 2nd - 8th | About 6.7% |
| Below 70 | Extremely Low | Under 2nd | About 2.2% |
📏SD Scale Comparison
| Test Family | Standard Deviation | IQ at 98th Percentile | IQ at +2 SD | IQ at +3 SD |
|---|---|---|---|---|
| Wechsler / WAIS / WISC | 15 | 131 | 130 | 145 |
| Stanford-Binet (modern) | 16 | 133 | 132 | 148 |
| Cattell / older tests | 24 | 149 | 148 | 172 |
The same rarity maps to a higher raw IQ when the scale uses a larger standard deviation, which is why a Cattell 148 is roughly a Wechsler 130.
📑Cross-Scale Comparison Grid
| Percentile | Z-score | Rarity (above) | IQ (SD 15) | IQ (SD 16) | IQ (SD 24) | Typical Band |
|---|---|---|---|---|---|---|
| 50th | 0.00 | 1 in 2 | 100 | 100 | 100 | Average |
| 75th | +0.67 | 1 in 4 | 110 | 111 | 116 | High Average |
| 84th | +1.00 | 1 in 6 | 115 | 116 | 124 | High Average |
| 91st | +1.34 | 1 in 11 | 120 | 121 | 132 | Superior |
| 95th | +1.64 | 1 in 20 | 125 | 126 | 139 | Superior |
| 98th | +2.05 | 1 in 50 | 131 | 133 | 149 | Gifted (Mensa) |
| 99th | +2.33 | 1 in 100 | 135 | 137 | 156 | Gifted |
| 99.9th | +3.09 | 1 in 1,000 | 146 | 149 | 174 | Highly Gifted |
| 99.99th | +3.72 | 1 in 10,000 | 156 | 160 | 189 | Profoundly Gifted |
🏆Famous Cutoffs
| Society or Marker | Percentile Cutoff | IQ (SD 15) | Rarity |
|---|---|---|---|
| Mensa International | 98th | 131 | 1 in 50 |
| Intertel | 99th | 135 | 1 in 100 |
| Triple Nine Society | 99.9th | 146 | 1 in 1,000 |
| Prometheus Society | 99.997th | 160 | 1 in 30,000 |
| Gifted program (common) | ~95th | 125 | 1 in 20 |
⚙Full Formula Breakdown
📋Reference Values
| Marker | Value | How It Is Used | Note |
|---|---|---|---|
| Mean | 100 | Center of every IQ scale | z = 0, exactly 50th percentile |
| SD 15 | Wechsler | Divides the IQ gap from 100 | Most common modern scale |
| SD 16 | Stanford-Binet | Slightly wider spread | Same rarity needs a higher IQ |
| SD 24 | Cattell | Widest common spread | Inflates high scores versus SD 15 |
| +2 SD | z = 2.0 | Gifted threshold marker | 97.72nd percentile on SD 15 |
💡Practical IQ Tips
Without translation into rank, however, the number is just a label. “I have an IQ of 130” carries a certain heft on its own, but lacks texture without context. In truth, it’s not the raw number that’s important; it’s what comes after, the percentile that follows it like a comet. It’s this one number that strip away the noise of any test’s quirks, and tells you precisely where you stand compared to all others: a snapshot of how rare (or not) you are.
After selecting the proper scale, the calculator above will do the math for you, translating a plain integer into something much more meaningful. This is an IQ score. The standard deviation That is the key variable. On the one hand, you’ve got Wechsler tests with a 15-point spread; on the other, you’ve got the Stanford-Binet using a 16-point spread, while older Cattell scales stretch up to 24.
Why Percentiles Matter More Than IQ Scores
That’s no simple academic nitpick: That’s what explain the confusion when we compare scores from these various tests. Two standard deviations above the mean translates into a 130 on Wechsler, 132 on Stanford-Binet, and 148 on Cattell; yet each represents the same person at the same percentile. The raw number varies because the yardstick has expanded or contracted, so that you can see someone scoring a 148 and think, oh, this is genius! You might not know that they are on a Cattell scale where that score is just gifted.
This behavior become less mysterious if we understand the bell curve. About half of us will score above a 100, and half of us will score below a 100 on tests like this; it’s the nature of the bell curve. So most of us are bunched up around the middle. Because there aren’t many people in the crowd, it quickly starts thinning out as you approach or retreat from the mean, making percentile jumps seem weird towards either end of the range. You gain perhaps 25 percentile points going from 90-100 IQ, but only maybe a handful when you go from 130-140, since now you’re sort of pushing off into thin air. It gets flatter and the rarity grows fast.
What does the tool do? It converts your score into a z-score (standardizing the results) which tells you how many standard deviations away from the mean you are. Then it uses the cumulative distribution function (you don’t need to know calculus to use this, but it’s helpful to know what’s going on here). By plugging in that z-score, the tool calculates area under the curve that falls to the left of your score. That is your percentile.
For example, if the tool comes back with 0.9772 as your area, that means you’re in the 97.72nd percentile, which means approximately 98 out of every 100 people will score below you. Percentiles above 90 are abstract. We can express them as one in N to make the gap more concrete. This is another way to look at those same statistics. It is one in 44. That’s an IQ of 130; push yourself up to 145 and you’re down to one in 741.
And here again these numbers aren’t small: They help explain why organizations such as Mensa, a society of high-IQ types, have such strict cutoffs. To get in, you need to land somewhere within the top two percent. On the common Wechsler scale, this comes out to around 131 points. The same logic applies to scores below the mean. A score of 70 isn’t merely low, but rather a sign of some serious cognitive difference; less than two percent of the population sits below that number.
Here the calculator puts those numbers into descriptive bands (Superior), Borderline, and these labels are helpful shorthand but should never be treated as rigid definitions of potential. Before you get too hung up on the last digit, though, there’s something else about those real IQ tests to keep in mind: they have a standard error of measurement. It’s not precisely a point; it’s a range, typically between 3-5 points in either direction from your actual score. So your true ability likely sits somewhere in that band.
No test is accurate enough to prove with confidence the extreme cases, like one in a million… Which are instead moddern estimates. (If you think this sounds crazy, note that no test can be normed accurately enough to prove these kinds of outliers.) That’s fine. The percentile is a well-grounded summary statement of where any given score fits. And the farthest out tails should of been viewed as interesting but likely, not absolute truth.
Until you convert it to rank, the number is just a label.