Monitor Real Estate Calculator
Measure the usable workspace your setup really delivers. Enter your resolution, OS scaling percent, and how many monitors you run, and this tool reports total pixels in megapixels, effective logical pixels after scaling, the physical desk area, and how many 1080p screens of productivity workspace you actually have.
🖥Real Monitor Setup Presets
🛠Workspace Inputs
Pick a common panel or choose Custom to type your own.
Higher scaling makes text bigger but shrinks usable workspace.
Native pixel width of one panel.
Native pixel height of one panel.
Multi-monitor totals sum workspace across displays.
Used for physical desk area and PPI context.
Used with the diagonal to size the physical panel.
The screen your workspace is measured against.
🔢Workspace Snapshot
🖥Resolution to Raw Workspace
| Resolution | Common Name | Raw Pixels | Megapixels | vs 1080p |
|---|---|---|---|---|
| 1366 x 768 | Budget laptop | 1,049,088 | 1.05 MP | 0.51x |
| 1920 x 1080 | Full HD | 2,073,600 | 2.07 MP | 1.00x |
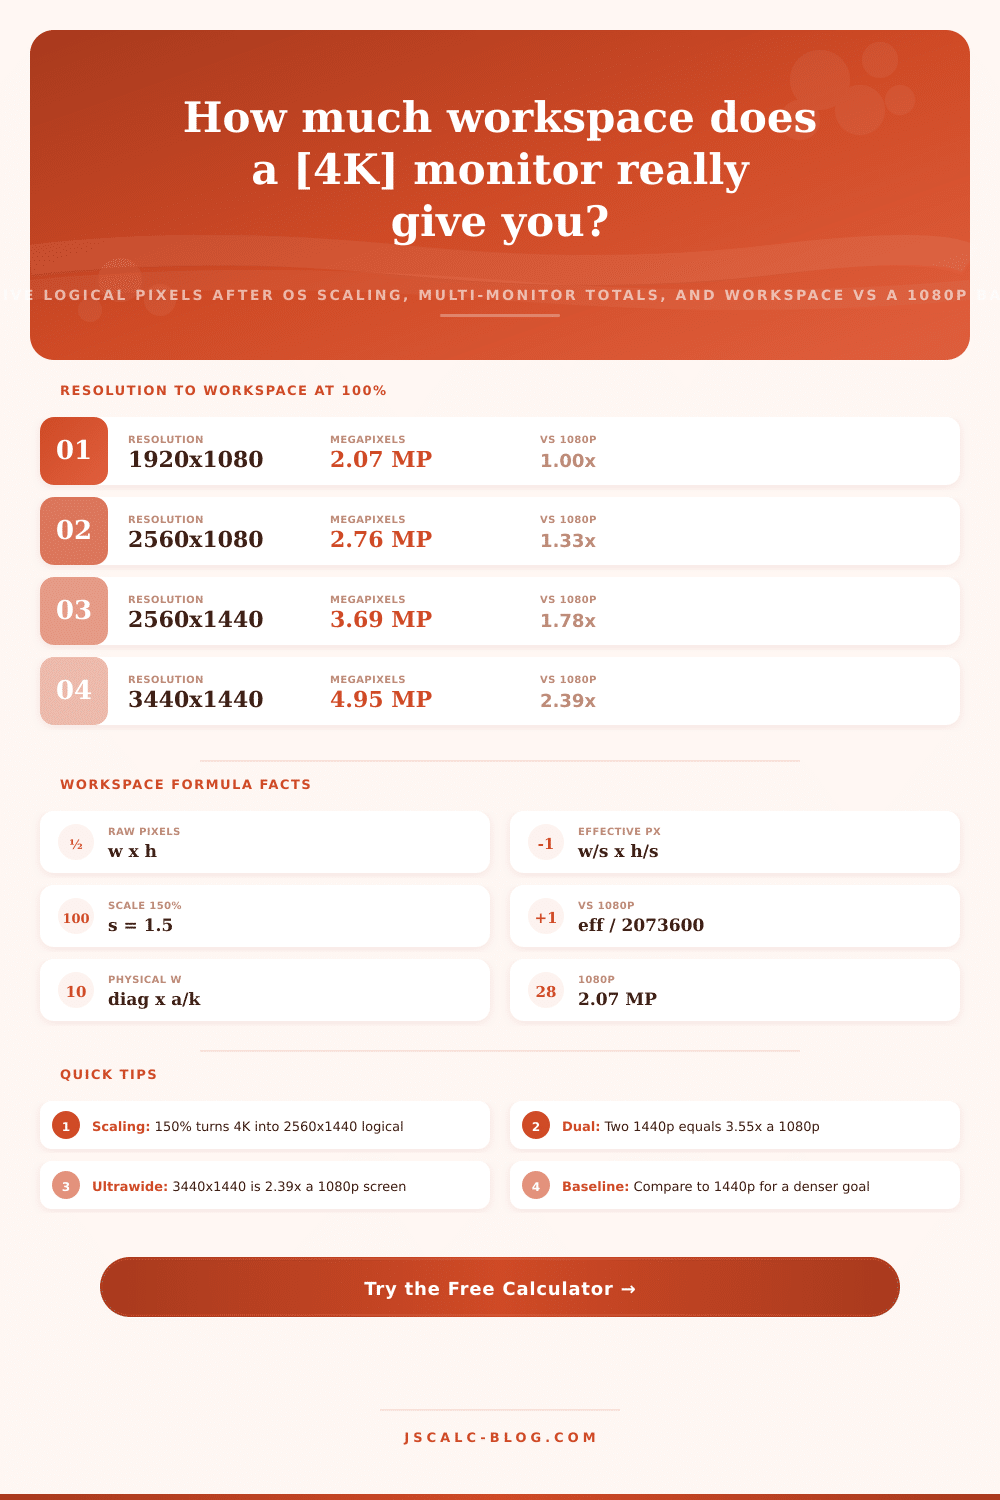
| 2560 x 1080 | UW-FHD | 2,764,800 | 2.76 MP | 1.33x |
| 2560 x 1440 | QHD | 3,686,400 | 3.69 MP | 1.78x |
| 3440 x 1440 | UWQHD | 4,953,600 | 4.95 MP | 2.39x |
| 3840 x 1600 | UW4K | 6,144,000 | 6.14 MP | 2.96x |
| 3840 x 2160 | 4K UHD | 8,294,400 | 8.29 MP | 4.00x |
| 5120 x 1440 | Super UW | 7,372,800 | 7.37 MP | 3.56x |
| 5120 x 2880 | 5K | 14,745,600 | 14.7 MP | 7.11x |
📏Scaling to Effective Logical Resolution
| Native Resolution | Scaling | Effective Logical | Effective MP | vs 1080p |
|---|---|---|---|---|
| 3840 x 2160 | 100% | 3840 x 2160 | 8.29 MP | 4.00x |
| 3840 x 2160 | 125% | 3072 x 1728 | 5.31 MP | 2.56x |
| 3840 x 2160 | 150% | 2560 x 1440 | 3.69 MP | 1.78x |
| 3840 x 2160 | 200% | 1920 x 1080 | 2.07 MP | 1.00x |
| 2560 x 1440 | 100% | 2560 x 1440 | 3.69 MP | 1.78x |
| 2560 x 1440 | 125% | 2048 x 1152 | 2.36 MP | 1.14x |
| 2560 x 1440 | 150% | 1707 x 960 | 1.64 MP | 0.79x |
| 5120 x 2880 | 200% | 2560 x 1440 | 3.69 MP | 1.78x |
🖱Multi-Monitor Workspace Totals
| Setup | Per Panel | Count | Total MP | vs 1080p |
|---|---|---|---|---|
| Dual 1080p | 1920 x 1080 | 2 | 4.15 MP | 2.00x |
| Dual 1440p | 2560 x 1440 | 2 | 7.37 MP | 3.55x |
| Triple 1080p | 1920 x 1080 | 3 | 6.22 MP | 3.00x |
| Dual 4K | 3840 x 2160 | 2 | 16.6 MP | 8.00x |
| Triple 1440p | 2560 x 1440 | 3 | 11.1 MP | 5.33x |
| Dual Ultrawide | 3440 x 1440 | 2 | 9.91 MP | 4.78x |
| Quad 1080p | 1920 x 1080 | 4 | 8.29 MP | 4.00x |
📊Effective Workspace Comparison Grid
| Setup | Native Res | Scaling | Effective Logical | Effective MP | vs 1080p |
|---|---|---|---|---|---|
| 27in 1080p 100% | 1920 x 1080 | 100% | 1920 x 1080 | 2.07 MP | 1.00x |
| 27in 1440p 100% | 2560 x 1440 | 100% | 2560 x 1440 | 3.69 MP | 1.78x |
| 4K at 150% | 3840 x 2160 | 150% | 2560 x 1440 | 3.69 MP | 1.78x |
| 32in 4K 100% | 3840 x 2160 | 100% | 3840 x 2160 | 8.29 MP | 4.00x |
| Ultrawide 3440x1440 | 3440 x 1440 | 100% | 3440 x 1440 | 4.95 MP | 2.39x |
| Dual 1440p | 2560 x 1440 | 100% | 5120 x 1440 | 7.37 MP | 3.55x |
| Triple 24in 1080p | 1920 x 1080 | 100% | 5760 x 1080 | 6.22 MP | 3.00x |
| Super UW 5120x1440 | 5120 x 1440 | 100% | 5120 x 1440 | 7.37 MP | 3.56x |
| Laptop 1440p 125% | 2560 x 1440 | 125% | 2048 x 1152 | 2.36 MP | 1.14x |
| 27in 5K 200% | 5120 x 2880 | 200% | 2560 x 1440 | 3.69 MP | 1.78x |
⚙Formula Breakdown
💡Workspace Optimization Tips
A 4K monitor displays eight million pixel. The spec sheet doesn’t mention how many of them you’ll actualy be able to use before you has to turn on scaling to make things readable. Most upgrade plans fall short in the gap between raw resolution and usable workspace. You purchase the big number and drop it on your desk, then you increase your operating system’s scaling to make things readable only to realize you have fewer pixels available on-screen than you had before on a 1080p panel.
The calculator above do the math when you input your resolution and your scaling percent so you don’t have to worry about coefficients and conversions, and it shows you exactly how much screen space you possess. It’s all about perspective… on pixels. A pixel represent the highest resolution that you can possibly get out of the screen. It’s the ceiling, not the floor.
What Are Effective Pixels?
But it doesn’t consider that in order to make things readable today, OSes blow up the interface. If you have a scale factor like Windows at 150%, your 1920 x 1080 screen act like 1280 x 720 screen. This happens because Windows divided your true height and width by 1.5 to give you something you can read. The thing is that you’re still getting those crisp pixels. But the space you’re working with feel smaller.
That’s the piece most people don’t understand when they buy into megapixels. They fail to recognize that the OS are going to gobble up half the pixel to make things easy to read. “Seeing all those abstract numbers makes it harder to really grok what it means. To help explain it, we compared your configuration with a known benchmark. In most cases, that would be a 1080p monitor, which contains approximately 2 million pixels. Dividing your logical pixel by that figure produce a simple multiplier. So if your answer is 1.78, then you’ve got almost double the work area of a Full HD monitor. That eliminates all the marketing gobbledygook around ‘4K’ and ‘5K,’ and lets you know how many document you could possibly stack next to each other. We’ve laid that out in a reference table on the page, which demonstrates how an unscaled 1440p monitor often end up on-par with a scaled 4K panel in terms of workspace. It’s a humbling thing to realize that working more doesn’t always mean higher resolution.”
Things get trickier with multi-monitors, which treat the total usable pixel on all monitors as if they were just one monitor. While a single 4K panel might have more raw pixels, two 1440p monitors with 100% scaling will provide far more usable real estate. (The bezel separating the displays is a natural window separator; many people prefer that to one giant blank canvas.) If you’re using multiple monitor, you can enter the count of identical monitor into the tool to see the impact each additional monitor has on your overall multiplier. More often than not, two reasonably-priced panel will out-perform one expensive display that you’ll scale down anyway.
Also keep in mind that some displays have a larger actual footprint, a big deal if pixel density require lots of scaling. Higher resolutions pack their pixels closer together (typically) compared to larger sizes, so you often end up having to scale down smaller monitor to get them looking sharp. To help you consider real-estate vs. Pixels, the tool accounts for both by calculating how much physical space they take up in square inches given their aspect ratio and diagonal size. So maybe a super ultrawide is more efficient based off your desk than two monitors… assuming your eyes aren’t complaining about the reduced PPI at 100% scaling.
In the end, the hero metric is effective workspace. It answers questions like: How much room do I have? Can I multitask? How many code pane will fit in this thing? Raw megapixels describe clarity. Effective pixels describe capacity. Plug in your setup, see the multiplier change, you’ll know exactly how much digital space you’ve got. Once you stop counting raw pixel and start counting usable space, you find the difference between specs and reality is less then you’d imagine. You should of seen it sooner.