Miscarriage Probability Calculator
Estimate the statistical chance of miscarriage and the chance a pregnancy continues, using published risk figures by gestational week, maternal age, ultrasound heartbeat, prior losses, and lifestyle factors.
🎯Common Scenarios
📝Your Pregnancy Details
Weeks from last menstrual period, as your provider counts them.
Egg quality and chromosome risk rise with age, especially after 35.
A confirmed heartbeat lowers remaining risk substantially.
🔢How the Estimate Is Built
📅Risk by Gestational Week
| Gestational Week | Typical Risk (No Scan) | Risk If Heartbeat Seen | What Is Happening |
|---|---|---|---|
| Choose values above to highlight your week. | |||
Figures reflect commonly cited ranges from ultrasound and cohort studies; individual clinics report slightly different numbers.
👧Risk by Maternal Age
| Age Band | Overall Clinical Risk | Relative Multiplier | Main Driver |
|---|---|---|---|
| Choose values above to highlight your age band. | |||
❤Effect of a Confirmed Heartbeat
| Week Heartbeat Seen | Risk Without Confirmation | Risk After Heartbeat | Approx. Reduction |
|---|---|---|---|
| Week 6 | 10% to 15% | About 5% | Roughly halved |
| Week 7 | 8% to 10% | About 3% to 4% | Large drop |
| Week 8 | 5% to 7% | About 2% | Large drop |
| Week 10 | 3% to 4% | About 1.5% | More than halved |
| Week 12 | 2% | About 1% | Halved |
Seeing cardiac activity is one of the strongest reassurance signals in early pregnancy.
📊Scenario Comparison Grid
| Scenario | Week | Age | Heartbeat | History | Estimated Risk |
|---|---|---|---|---|---|
| Early, young | 6 | 25 | No | None | ~11% |
| Heartbeat seen | 8 | 30 | Yes | None | ~2% |
| End first trimester | 12 | 35 | Yes | None | ~1.5% |
| Older mother | 10 | 40 | No | None | ~14% |
| Recurrent loss | 7 | 34 | No | 2 losses | ~19% |
| Advanced age | 8 | 42 | No | 1 loss | ~24% |
| Second trimester | 20 | 32 | Yes | None | <1% |
Example outputs from this model rounded for illustration; your own result depends on the exact inputs entered above.
⚙Full Method Breakdown
📋Risk-Factor Reference
| Factor | Typical Setting | How It Is Used | Direction of Effect |
|---|---|---|---|
| Gestational week | 4 to 20 weeks | Sets the base rate B | Risk falls sharply each week |
| Maternal age | Under 35 to 45+ | Multiplier A on B | Rises steeply after 35 |
| Heartbeat seen | Yes or no | Reduction factor H | Lowers risk substantially |
| Prior miscarriages | 0 to 3+ | Adds relative points | Raises risk modestly |
| BMI band | Healthy to obese | Adds a few percent | Raises risk at extremes |
| Smoking | None to heavy | Adds a few percent | Raises risk with amount |
💡Reading Your Result
So much of early pregnancy is the wait. You’ve gotten a dodgy positive test result, or worse yet missed your period, but no one has done an ultrasound yet. What’s normal? What isn’t? Early in pregnancy it’s naturaly that you’d like some solid information to help ease your worries.
That’s where this calculator comes into play; it offer you a statistical guess about when things will happen given your timeline and patient profile. But it’s also important to understand what it means.
Understanding Your Pregnancy Risk
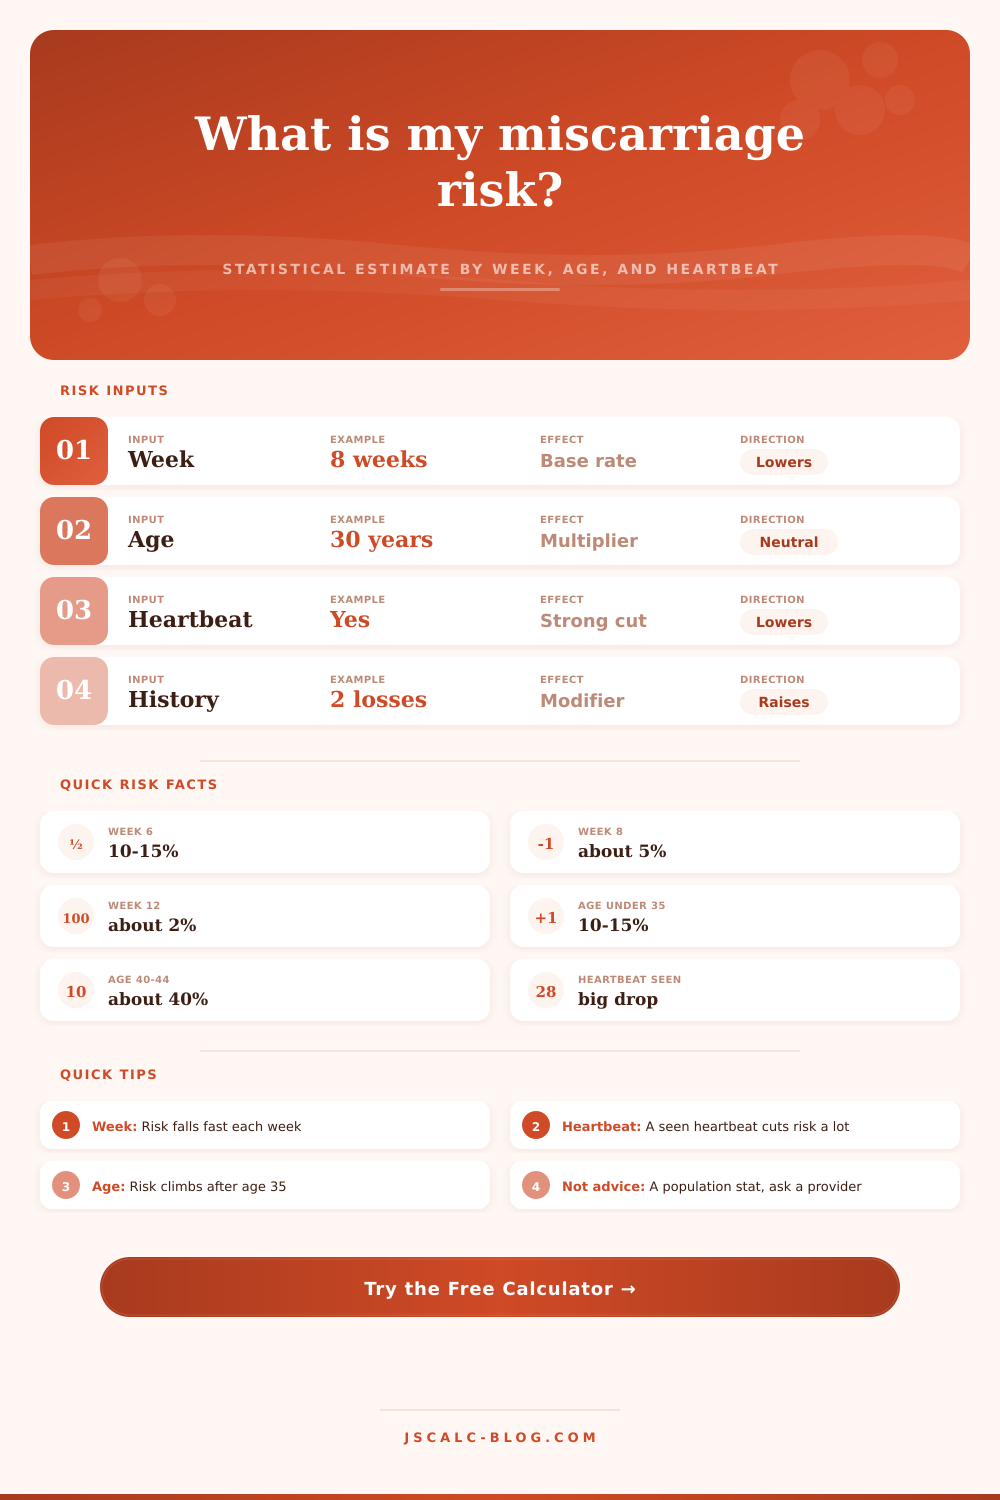
The biggest variable here are gestational age. There’s a certain time frame when the body scan for chromosomal abnormalities and once that time frame passes, it dissapears fast. For a typical patient, the odds is roughly ten percent to fifteen percent at six weeks. That number may sound large but it’s correct. At eight weeks, it falls to roughly five percent. At twelve weeks, it float around two percent. And the rate doesn’t flatten out, it plummets with every passing week. With every safe day, you move further away from danger zone and closer to being out of highest-risk period.
Age is a multiplier, not a decision in and of itself. Baseline: women under 35 are at risk; women over 40 are at greater risk still. Depending on the study, that means doubling or tripling their risk. Why? As eggs get older, they becomes more likely to have chromosomal abnormalities. It’s simply biology. It has nothing to do with your state of health; that’s a cellular fact of aging.
Maternal history also interact with gestational age, as the reference table explains. If you’re in that group, you can’t alter your age, only its impact on probability, so knowing how it shifts things help you contextualize warning signs without panicking over every little tummy twinge.
The good news is that a positive heartbeat provide a very reassuring piece of information. Seeing a heartbeat on ultrasound brings the rest of the risk down a lot. For example, if you see a heartbeat at eight weeks, your own personal risk could of been cut down to about two percent (from five percent). That’s when providers will typically cut back some caution because the heart rate mean that the embryo has already cleared most of initial hurdles of survival.
But there’s no need to assume this time will be differenter because of prior losses. A single or double previous miscarriage increase the stats by adding a bit more risk (a modest percentage) above baseline. It could indicate an underlying problem such as a clotting disorder, but it can also demonstrate that your body is capable of carrying pregnancy.
Lifestyle choices like your smoking status and BMI adds small amounts to your risk profile. Both impact vascular health through stress and inflammation and can contribute to unstable implantation. Unlike genetics and age, these are variables within your control. Even if those odds stack up against you, it allow for some agency: You know what to work with.
Those numbers are statistics about populations, not people. One in fifty pregnancies results this way; that is the two percent. That doesn’t imply that your current pregnancy has a high likelihood of going wrong (if you’ve previously delivered healthy babies). The stats take the bumps out off the road. They can’t consider who you are as a person. They can’t consider how strong you are physically. They can’t consider whether you and your partner is genetically compatible. Think of it as a map of territory, rather than an oracle predicting what will happen to you.
It makes things less scary when you understand what’s going on. The worst part is early on. And it get better with time. Every week that goes by is another step forward. Trust the numbers to guide you, but take care of yourself throughout the journey day by day.