Mean Median Mode Calculator
Paste any list of numbers to find the mean, median, mode, and range, plus sum, count, midrange, quartiles, interquartile range, and a full frequency table of every value.
📌Sample Data Sets
Tap a set to load real numbers into the box below and calculate the measures of central tendency instantly.
🔢Your Data Set
Text and blanks are skipped when the ignore option is on. Example: 12, 15, 15, 20, 21.
Shown next to results for context only.
🧮Data Set Snapshot
📋Sorted Data List
| Position | Value | Running Sum | Note |
|---|---|---|---|
| Enter numbers above to see the ordered list. | |||
📊Frequency Table
| Value | Count | Frequency | Cumulative |
|---|---|---|---|
| The value counts appear after you calculate. | |||
📈Five-Number Summary
| Statistic | Value | How It Is Found | What It Tells You |
|---|---|---|---|
| The five-number summary appears after calculation. | |||
📐Mean vs Median vs Mode
| Measure | What It Is | Best Used When | Weakness | Outlier Effect | Data Type |
|---|---|---|---|---|---|
| Mean | Sum divided by count | Data is fairly symmetric | Sensitive to extremes | Pulled toward outliers | Interval or ratio |
| Median | Middle of the ordered list | Data is skewed | Ignores exact spacing | Very resistant | Ordinal and up |
| Mode | Most frequent value | Categories repeat | May not exist or vary | Not affected | Any, incl. nominal |
| Range | Max minus min | A quick spread check | Uses only two points | Highly affected | Interval or ratio |
| Midrange | Average of min and max | Rough center estimate | Ignores middle values | Highly affected | Interval or ratio |
| IQR | Q3 minus Q1 | Spread without extremes | Needs at least four points | Resistant | Ordinal and up |
⚙Full Formula Breakdown
🗂When To Use Each Measure
| Scenario | Recommended | Why | Watch Out For |
|---|---|---|---|
| Class test scores | Mean | Scores cluster with no wild extremes | One zero can drag the mean down |
| Household incomes | Median | A few high earners skew the average | Mean looks higher than typical |
| Favorite shirt size | Mode | Sizes are categories that repeat | Two sizes may tie for the lead |
| Home sale prices | Median | Luxury sales pull the mean upward | Report median, not average |
| Daily temperatures | Mean | Readings are steady and balanced | A heat spike shifts the mean |
| Survey 1 to 5 ratings | Median or mode | Ordinal data with common answers | Mean of ordinal data is fuzzy |
💡Practical Statistics Tips
Do you recall being in school and having your math teacher give you a list of numbers? He’d put 10 scores on blackboard and demand the average. You knew it was busy work, a math rite that realy didn’t matter. But statistics isn’t about taking a quiz. It’s about telling truth about a set of things or people without accidently lying.
Sure, this calculator here will run the numbers for you immediately, but it takes a little more than pushing a button to understand what those numbers really tells you. Most people thinks of the average as the mean. Add it all up, divide by count. Every individual data point matter equally, which is what makes it feel so democratic. And that’s also its fatal weakness.
Mean, Median, and Mode Explained Simply
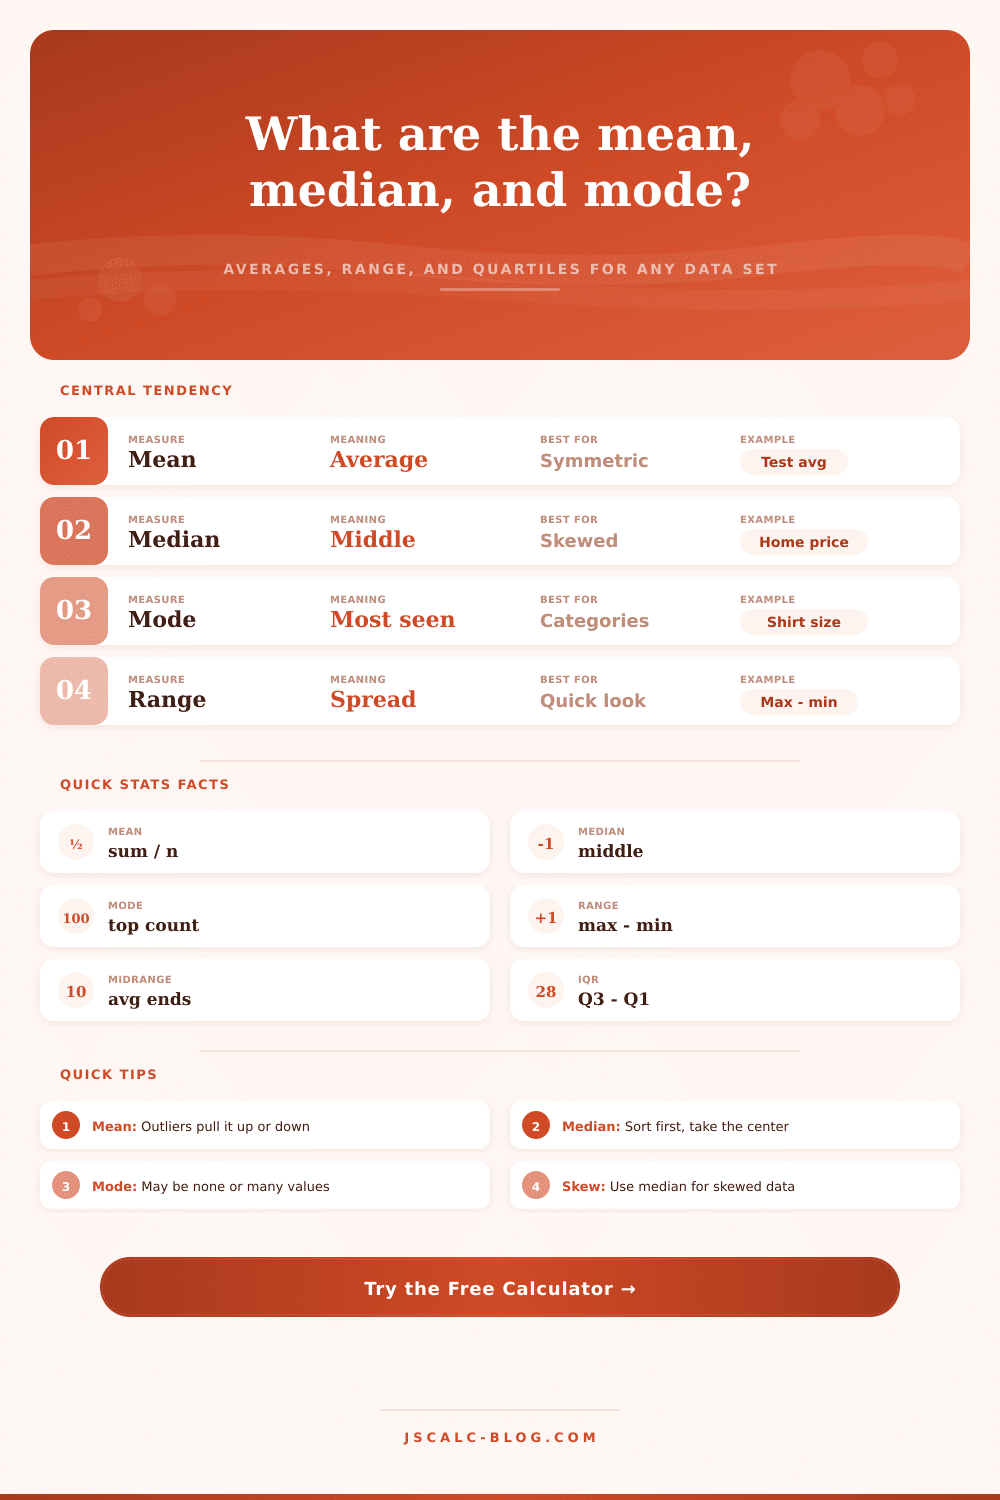
Of ten people in a room, if nine have ten bucks apiece, and one has a million, the average wealth in the room will be huge. It doesn’t tell you anything about what a typical person in the room have in their pocket. The mean is like a kite, and outliers, extreme values, are the wind in the kite’s sail. It works beautifuly with symmetric data where extremes are rare and balanced such as daily temperature readings or test scores.
And then there’s the median. That’s the number smack dab in the middle if you line everything up from low to high. The median doesn’t give two craps about billionaires. The median just gives two craps about where you stand. Want to know what a “typical” house price is in a city that has both mansions and shacks? Your friend is the median. The median splits the list right down the middle. Half are above it; half are below it.
The median resists the noise, the median is stable. And when the data is skewed, as it often is in the real world, the median tell you a more honest story about what the center of things looks like.
And then there’s this one. It is the mode. In terms of categories, it doesn’t matter so much (although in numbers it do). For example, let’s say you sell clothes. How big of a shirt should you make? Well maybe the average shirt size is 4.7. That tells you nothing. You don’t sell shirts that are between a size four and size five.
You want to know which size sells the mostest. And that’s where the mode comes into play. There may not be any mode at all for a set of data. Everything could be unique or there may be several modes. Two sizes could be tied for being the most popular. Unlike other measures of central tendency, the mode will work with name or color data.
So that’s what’s happening around the center? You also want to know the spread. The range is simple. It is the maximum minus the minimum. However, it’s delicate. It relies completely on two end points. If you record one max incorrectly, boom, it is gone.
Interquartile range: Smarter. Look at just the middle half of the data. Ignore the tails. By ignoring the tails, it stays resistant to outliers. It shows you if the core of your data are all close together or spread far apart. The table on the page spells this out nicely and show you when to use which metric.
Which of these tools do you use? It depends on what you’re measuring and how it’s shaped. For example, if you’re looking at survey ratings (e.g., one through five), you might want to avoid using the mean because the gaps aren’t actualy equal mathematical distances; in this case, the median/mode are typically more useful.
If you’re examining distributions of income, keep an eye out for skew. Incomes are skewed: A few high earners will pushes the mean up to some crazy number that nobody really earns. The fancy sound of “mean” makes it tempting to reach for it. But sophistication lies in employing the appropriate tool for a task. In some cases, the most straightforward tool, such as the median, tell us more then the most complex measure.
You’ve got your numbers. Let the calculator do the math. You’re responsible for determining what story the numbers tell you, and whether or not that’s the same as what actualy happened. That’s the difference between data and wisdom.