Lot Coverage Ratio Calculator
Calculate building footprint coverage, remaining allowed footprint, planned addition impact, setback usable area and impervious surface coverage.
| Measure | Formula | What to include | Planning note |
|---|---|---|---|
| Lot coverage % | Building footprint / lot area × 100 | House, garage, covered patios, counted accessory structures | Use the code definition before final permitting. |
| Max allowed footprint | Lot area × max coverage % | Allowed structure footprint area | Other rules can still limit placement. |
| Remaining buildable coverage | Max allowed footprint - existing footprint | Unused structural footprint allowance | Negative values mean the site is already over the limit. |
| After-addition coverage | (Existing footprint + addition) / lot area × 100 | Current counted footprint plus proposed addition | Compare to both max coverage and setbacks. |
| Impervious coverage | (Footprint + paving) / lot area × 100 | Structures, driveway, walks, patios, pool decks | Stormwater rules may set a separate cap. |
| Zoning type | Typical lot coverage range | Setback pressure | Common issue | Calculator default |
|---|---|---|---|---|
| Single-family R-1 | 25% to 40% | Moderate | Garage and porch counting | 30% |
| Two-family R-2 | 30% to 45% | Moderate to high | Parking and accessory structures | 35% |
| Townhouse / rowhouse | 45% to 70% | High | Small lots and shared walls | 60% |
| Mixed-use neighborhood | 55% to 85% | High | Lot coverage vs FAR distinction | 75% |
| Neighborhood commercial | 60% to 90% | Variable | Parking impervious area | 80% |
| Light industrial | 50% to 85% | Variable | Yard paving and drainage | 70% |
| Rural residential | 5% to 20% | Low to moderate | Accessory buildings over time | 12% |
| Scenario | Lot area | Existing footprint | Current coverage | Max coverage | Remaining | Impervious |
|---|
So there you are: you have a sketch in one hand, a zoning ordinance in another, and you’re standing in your own backyard wondering if it’s legal to build exactly what you want. Here’s why this scenario plays out often for homeowners. They think, “As long as my house fits on the piece of dirt I bought, I’m good to go.” Unfortunately, this isn’t the case. Local codes aren’t just concerned with fit. They also care about openness of land, or how much is covered by structure versus how much is left uncovered. How much is left uncovered for things like drainage, landscaping, and light.
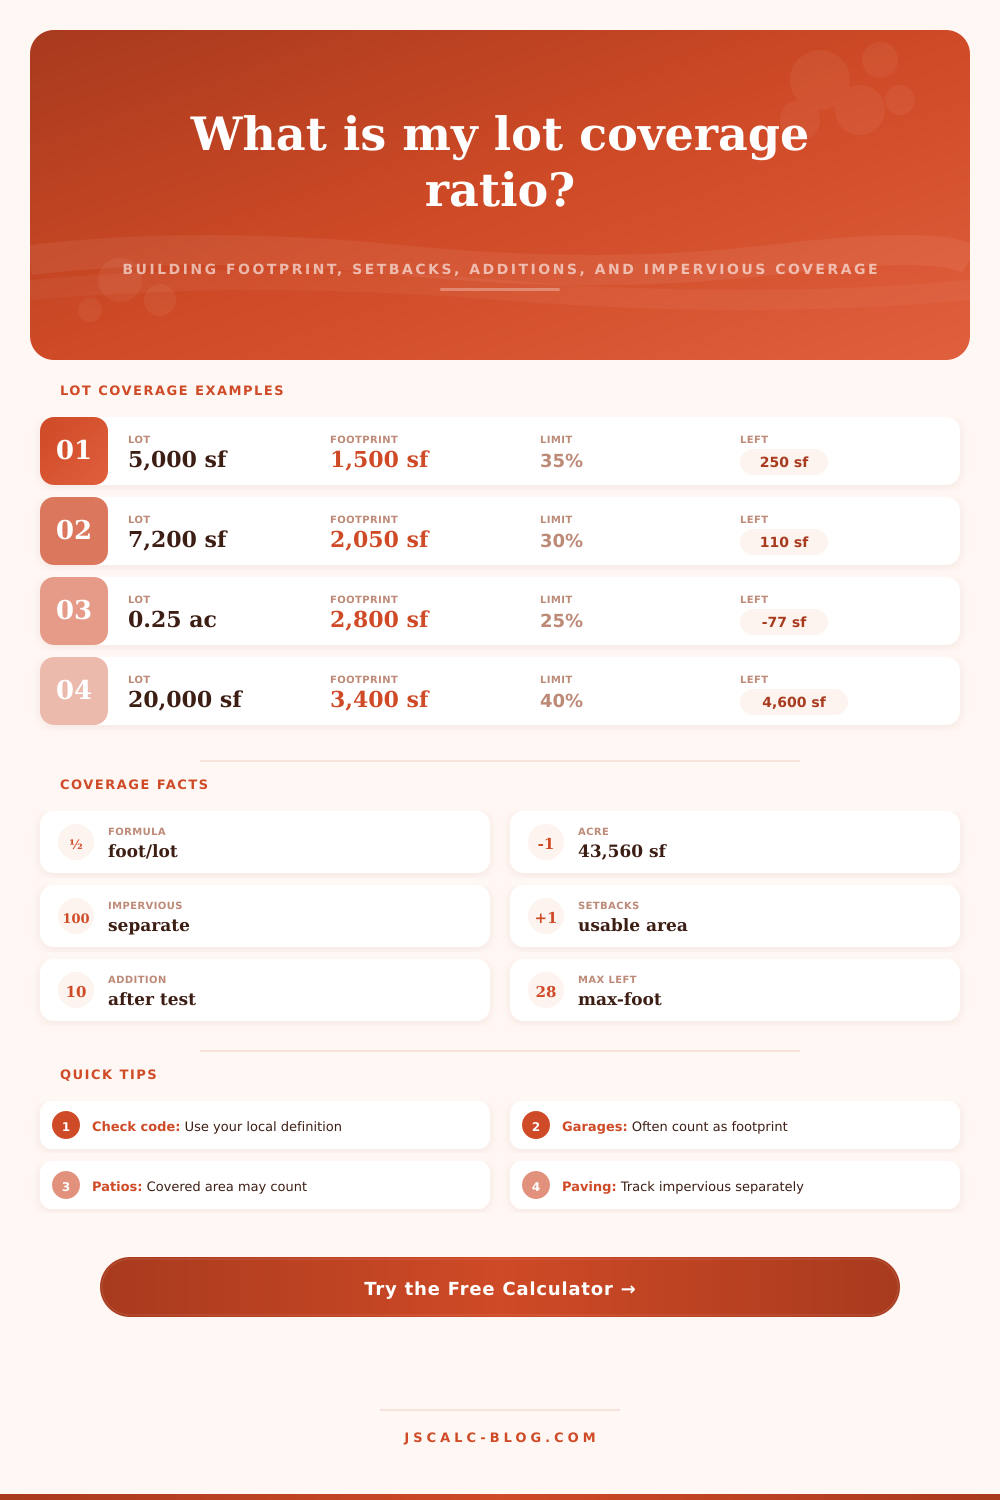
Knowing your lot coverage ratio isn’t just a necessary bureaucratic checkbox; it’s also a practical necessity. Sounds like basic math, right? But there’s more to it than meets the eye when applying it in real life. Basically, it’s taking the TOTAL footprint (square feet) of ALL allowed structures on your land and dividing it by total area (square feet) of the land itself. That becomes your percentage. This will tell you what portion of your land is being covered by your buildings.
What Is Lot Coverage?
In most residential zones, there’s a hard cap on this percentage. It is typically about 30% for single family homes, though some townhouse districts may push into the high 30s. Rural areas tend to see this number dip down quite a bit. Beyond that, no matter how great the design, you’re not able to get a permit for the addition.
The calculator up top do all the grunt work for you. Simply put in square footage of your main house plus any garage, shed, cover, or patio. It’ll sum everything up to show you exactly how many square feet of existing space you have and how much you have left until you reach the wall.
Most folks overlook this. While “building” coverage affects your structural footprint ratio and your lot’s available area, “impervious surface” covers almost anything else. This includes driveways, which do not count as part of your structure but still block rain from soaking in to the ground. Many cities has their own limits on total imperviousness (to control stormwater runoff). You could build within your building limit and then pave over half your yard with a giant driveway, but find yourself racking up stormwater fines, or be forced to install an expensive retention pond. To avoid this surprise, the tool splits these concepts apart; you’ll be able to view your structural headroom AND your paving load at the same time.
This brings us back around to where we began: Pure area measurements don’t account for another layer of complexity. Setbacks. Even if your math shows enough total square footage remains on paper, every bit of open space might be right up against an easement. It could also be buried behind mandatory front yard line. That space isn’t good for anything useful to you when it comes time to build. Available area does not equal usable area.
Because of this, the calculator also includes a field for usable area within setback requirements. This helps you understand how much free space you actualy have, even after entering required information into calculation fields. If your lot has two-thousand square feet of open area available but legally off-limits, knowing that doesn’t mean jack squat. Knowing about geometry of what’s possible, however, allows you to start drawing in some practical layout options as well as doing the math.
For example: imagine adding just two hundred square feet to a deck. That’s hardly a dent on a big quarter-acre suburban lot, but it could be enough to put you over the edge altogether on a skinny, five-thousand-square-foot urban infill lot. In other words: It’s the context that counts, not just the bare percentage. Forty-percent seems like a generous coverage limit … until you discover that your house itself covers thirty-five percent, plus another ten percent for your garage. Maybe there isn’t even room for a typical storage shed left over on those last five. Knowing this up front will save you from wasting months redesigning. Or worse, hiring an architect only to have the planning department tell you “no.”
Useful reference tables provided with the tool also offer some helpful benchmarks to see how dense of a building is allowed in various zones (for example), compare mixed-use corridors to single family R-1 zones to see how they differ in their tolerance for built mass. Note that these ranges are typical municipal code ranges. They aren’t hard-and-fast laws; always double-check your locality’s specific figures before you commit to anything. But it does show the trend towards greater density in more recent developments as well as the conservative preservation standard in older ones. Knowing which side of that continuum your house sits on will give you a better sense of how flexible you might be.
That’s why we calculate coverage: to respect the give-and-take between open space and built form. We do this to keep from smothering your lot’s natural processes and to avoid overstepping the collective understanding of your community. When you account for both structural footprint and impervious surface, you can see more clearly where boundaries lie and no longer wonder if an idea will work. You no longer hope, but instead build confidently within defined limits. And that helps turn a seemingly impossible zoning riddle into a design challenge that’s do-able.