Fixed vs Variable Rate Comparison Calculator
Compare a plain fixed-rate loan against a variable-rate loan that starts at a lower intro rate and then drifts under a rate-trajectory assumption. See the total cost of each over the years you plan to hold the loan, your projected savings or loss from choosing variable, and the break-even average variable rate.
🎯Real Fixed-vs-Variable Scenarios
📝Loan and Rate-Trajectory Inputs
Principal borrowed on both loans, in dollars.
Full amortization length used for both loans.
The locked rate on the fixed-rate loan.
Starting rate on the variable loan, usually lower.
Years the intro rate holds before adjustments begin.
Yearly move after intro. Positive rises, negative falls.
Lifetime ceiling the variable rate can never exceed.
Years you keep the loan before selling or refinancing.
🔢Comparison Snapshot
📊Rate-Change Assumption Comparison Grid
Reference example: $400,000 loan, 30-year term, 6.8% fixed, 5.9% variable intro for 1 year, 11.9% cap, held 7 years. Fixed 7-year cost is $219,047 ($2,608/mo). Variable cost is the sum of payments as the rate steps each year on the outstanding balance.
| Annual Rate Change | Var End Rate | Fixed 7yr Cost | Variable 7yr Cost | Difference | Verdict |
|---|---|---|---|---|---|
| -1.0% / yr (falling) | 0.0% | $219,047 | $145,887 | -$73,160 | Variable |
| -0.5% / yr | 2.9% | $219,047 | $170,687 | -$48,360 | Variable |
| 0.0% / yr (flat) | 5.9% | $219,047 | $199,294 | -$19,753 | Variable |
| +0.5% / yr | 8.9% | $219,047 | $231,106 | +$12,059 | Fixed |
| +0.75% / yr | 10.4% | $219,047 | $248,039 | +$28,992 | Fixed |
| +1.0% / yr | 11.9% (cap) | $219,047 | $265,556 | +$46,509 | Fixed |
| +1.5% / yr | 11.9% (cap) | $219,047 | $286,544 | +$67,498 | Fixed |
| +2.0% / yr | 11.9% (cap) | $219,047 | $297,423 | +$78,376 | Fixed |
📋Fixed Monthly Payment by Rate
| Fixed Rate | $200k / 30yr | $300k / 30yr | $400k / 30yr | $500k / 30yr |
|---|---|---|---|---|
| 5.0% | $1,074 | $1,610 | $2,147 | $2,684 |
| 5.5% | $1,136 | $1,704 | $2,271 | $2,839 |
| 6.0% | $1,199 | $1,799 | $2,398 | $2,998 |
| 6.5% | $1,264 | $1,896 | $2,528 | $3,160 |
| 6.8% | $1,304 | $1,956 | $2,608 | $3,259 |
| 7.5% | $1,398 | $2,098 | $2,797 | $3,496 |
| 8.5% | $1,538 | $2,307 | $3,076 | $3,845 |
📏Intro Discount Needed to Justify Variable
| Holding Period | Slow Rise Risk | Discount to Break Even | Practical Call |
|---|---|---|---|
| 3 years | Low exposure | 0.25% or more | Variable often wins |
| 5 years | Moderate | 0.50% or more | Variable leans ahead |
| 7 years | Moderate to high | 0.75% or more | Depends on trajectory |
| 10 years | High | 1.00% or more | Fixed gets safer |
| 15 years | Very high | 1.50% or more | Fixed usually wins |
| Full 30 years | Maximum | 2.00% or more | Lock the fixed rate |
⚙Formula Breakdown
💡Fixed vs Variable Decision Tips
The decision between taking out a variable- or fixed-rate loan is one of the most important financial decisions you’ll ever make. Typically this is simply a trade: A variable loan offers you a lower rate now, but leaves you uncertain about what will happen tomorrow. Rather than relying on gut feeling, the Fixed vs Variable Rate Comparison Calculator resolves this trade using numbers.
Simply input the loan amount, term, fixed rate, variable intro rate and how long it lasts, an assumed yearly rate change, a lifetime cap, and how long you plan to hold the loan. The calculator will project the overall cost along both paths, allowing you to determine which comes out ahead.
How to Choose Between Fixed and Variable Loans
This last factor (your planned term of ownership), is the least considered input in this analysis. Most 30-year mortgage holders don’t actualy keep that mortgage for 30 years; they pay it down, sell, or refinance it sometime during the first ten years. If you’re planning on owning a variable-rate loan just for five years (enjoying its low teaser rate and bailing out before it goes up), it may save you a pile, even though it costs a king’s ransom spread over thirty years. The calculator takes into account your cost only for the time you own the debt. With this single change; shifting your ownership timeline from five to fifteen years. A variable and a fixed loan may flip-flop between being the smartest choice.
The easy half of this comparison is the fixed loan. Each month you pay a set amount, hence why we calculate its payment using the standard amortization formula, where P is the principal, r is the monthly rate, and n is the number of months in the full term. A $400,000 mortgage at 6.8% for 30 years will result in a roughly $2,608 per-month payment. That is simply how much you’ll spend on that loan during your holding period, multiplied by how long you own the property. Since each payment is fixed, there’s no uncertainty with a fixed-rate loan.
For the variable loan it gets trickier (and therefore more important). At this stage, it begins with an intro rate that is typically below the fixed rate and applies that rate throughout the intro period, based on what you entered in the form. Once the intro period ends, the calculator will raise the rate each year based on your assumption. This could be a half-percentage-point increase, a full point, or even a decrease if you think rates are headed downward. When the rate shifts, it recalculates the payment based on the new amount, the current outstanding balance, and the remaining number of months left… Exactly how a real-world lender would recast it. And it never lets the rate rise above the lifetime cap you inputted. That means the forecast honors the ceiling that’s written into most variable agreements. Add up all the payments from one step to the next, and voila: the projected variable price tag.
Before the card breaks out the apples-to-apples comparison, it leads with an in-plain-text verdict; then it presents that same comparison across four cards. There’s the fixed total cost over the length of time you hold it. Next: the variable projected cost based on your assumptions and where that puts you at the end, where does the rate sit and what’s the corresponding payment? Third card: the savings if you opt for variable. That card subtracts one cost from another. A positive number means the variable loan will be cheaper. A negative number means the fixed loan is the winner.
The fourth card is often the most valuable for making a choice: the break-even variable rate. For your entire holding period, how much lower must the averaged variable rate be compared to your fixed rate for it to cost you the same as your fixed loan? That’s the one flat variable rate which will get you to break even. It sits right on top of your fixed rate, because the two loans have the same math (same principal, same term, same amortization). A variable rate only wins if it falls below your fixed rate during certain years; otherwise, the fixed rate will have beaten it by the time you sell. Your intro discount gets you off to an easy start. But each year of step-up whittles away at it, so really what you’re betting is: Will the average of all your variable rates beat the average of your fixed rate before you sell?
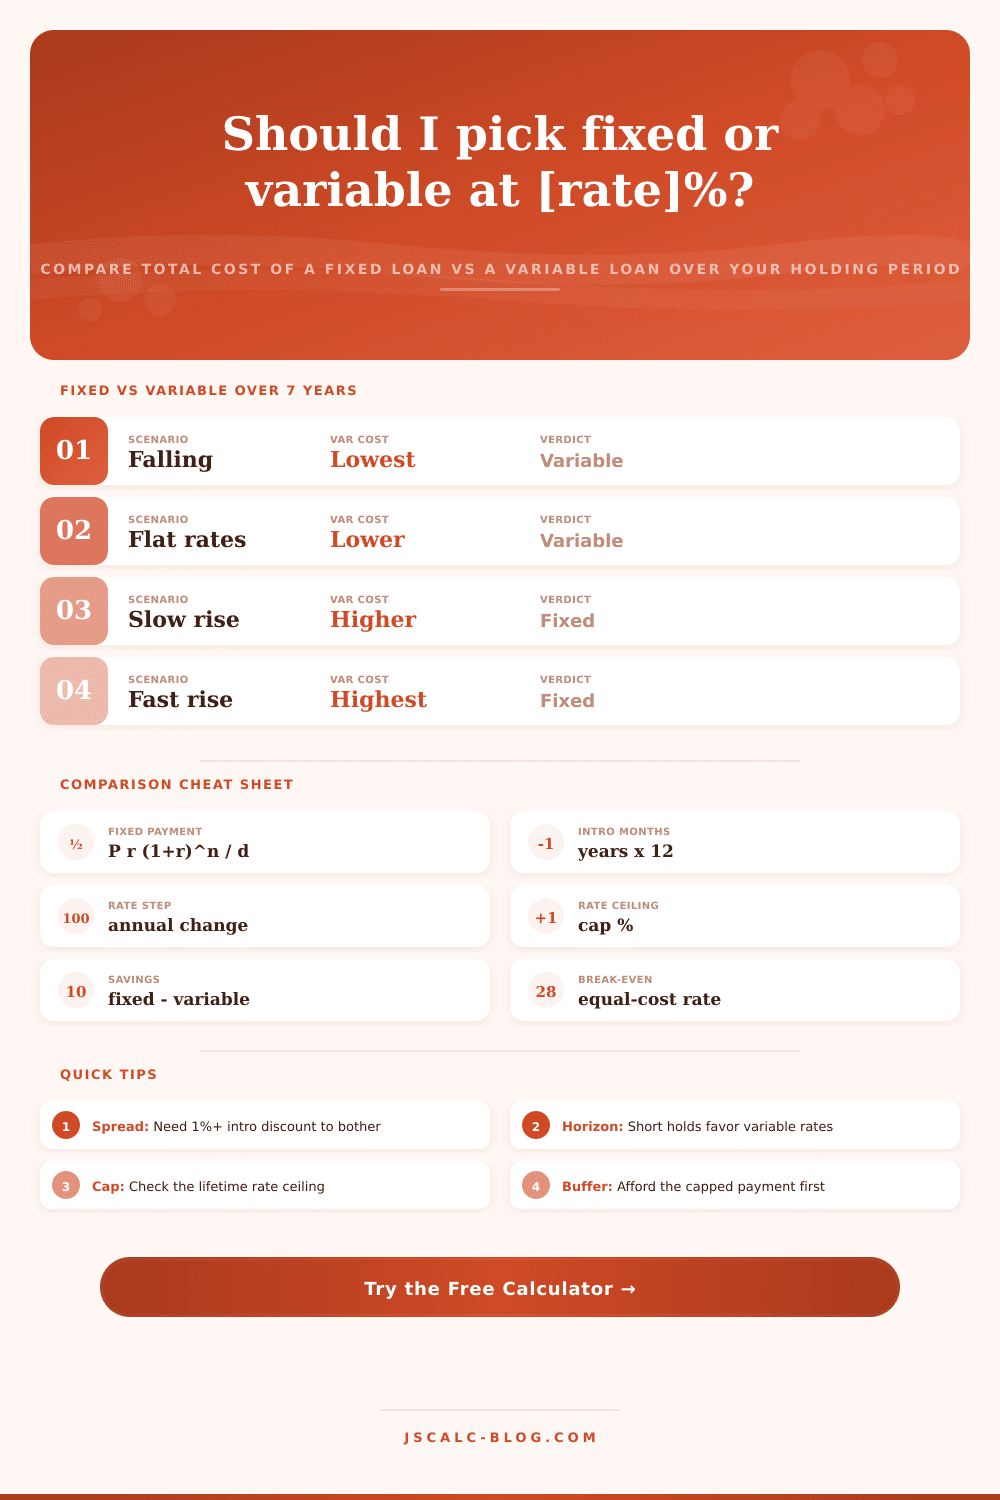
That’s why the calculator offers a comparison grid where you run the same loan through eight different rate-change assumptions, ranging from rising two points per year to dropping a point each year. This way, you read down the grid, which shows if a variable rate works best at flat and slow-rising rates, but fails only when rates spike towards the cap. Then you decide whether such a spike is all that likely. The grid puts the risk into view.
It also matches up with presets for some typical situations. These become a good choice through two practical rules. One: Demand a meaningful spread. When planning to hold longer than seven years, a variable intro rate that’s a few tenths-of-a-percent lower than the fixed rate simply isn’t worthwhile; aim instead for a minimum of three-quarters of a point discount. Second, stress-test the cap. What would the payment be if the variable rate reaches its lifetime ceiling? If the capped payment squeezes your budget, pay extra for the safety of a fixed rate; even if the variable loan initially appears cheaper on paper. It is better to borrow money you can always afford to repay than money that might save you a little now but could grow out of control later.
Graduates comparing student loans: Refinancing fixed vs. Variable. Some homeowners are thinking of refinancing from a variable to a fixed mortgage (or vice versa). Home buyers comparing an adjustable-rate mortgage vs. One option is a fixed-rate mortgage. For each case, take away the angst and turn it into arithmetic. Pick the preset that describes your situation. Dial in your actual quote for each input. Read the break-even rate alongside the four cards and the verdict. Within seconds, you’ll see which loan is cheaper given your assumptions … and how much room you have before that answer flips.
Fixed or variable isn’t about guessing the future correctly; it’s about knowing precisely how much you’re paying for that guess, and determining whether the discount now is worth the risk later.