Late Penalty Grade Calculator
Calculate the adjusted assignment grade after late penalties, including percent-per-day, percent-per-hour, flat point losses, grace periods, caps, floors, category weight impact, and projected course grade effect on JSCalc-Blog.com.
Load a common syllabus policy, then edit any field to match the exact wording for your course.
A "started day" policy means 1 minute late can bill as 1 full day unless the grace period covers it.
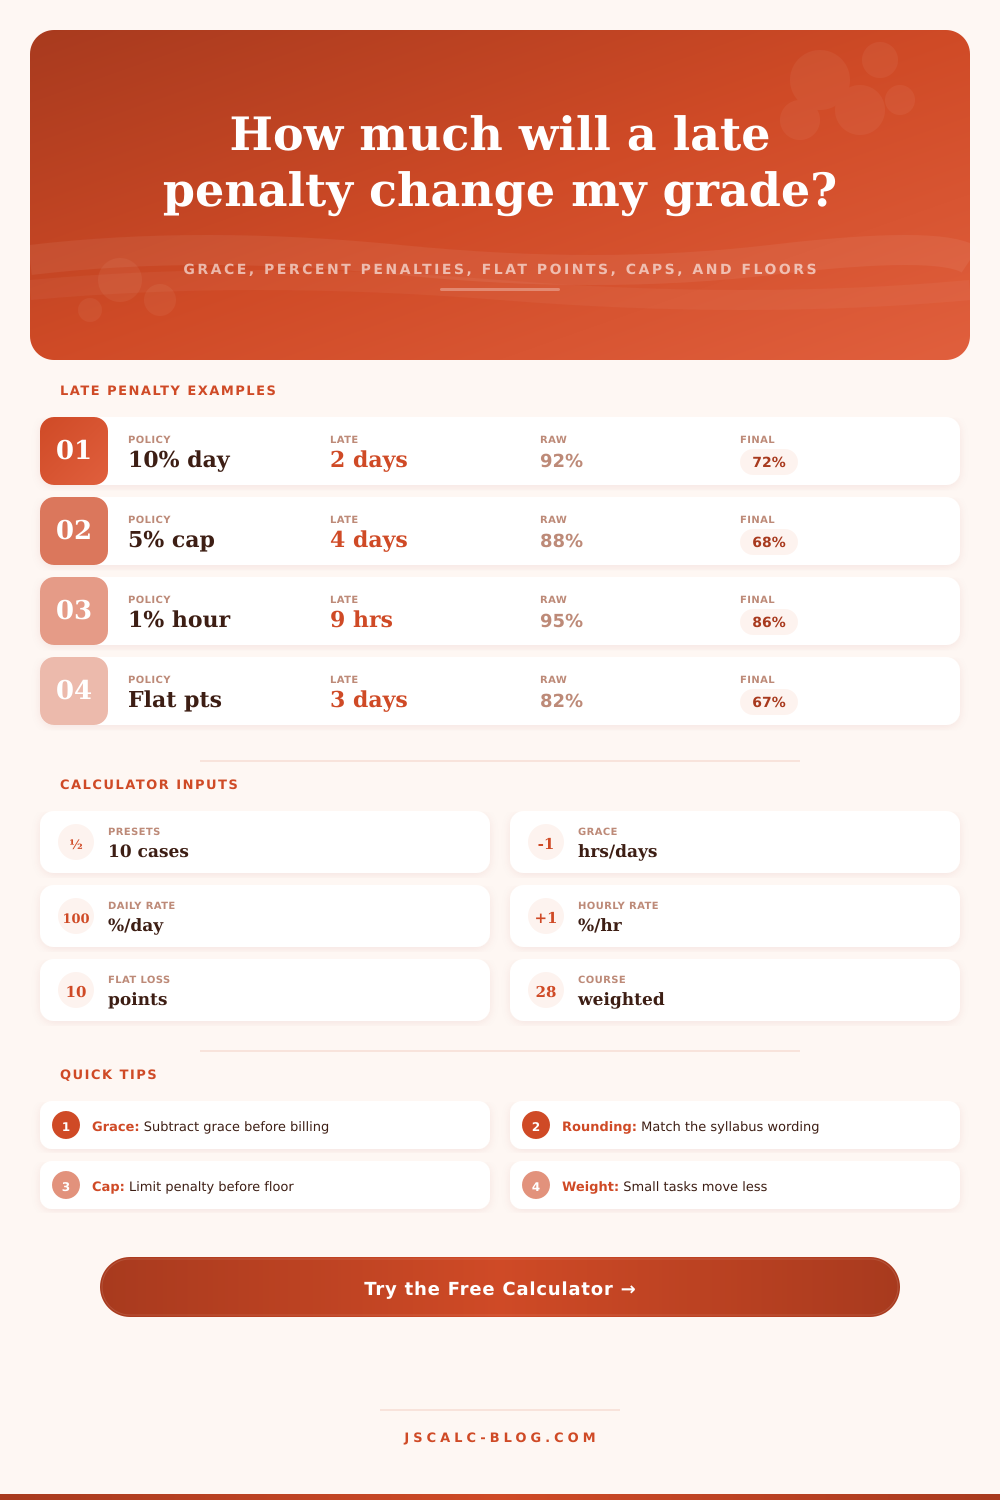
| Policy preset | Daily percent | Hourly percent | Flat points | Grace | Cap / floor |
|---|---|---|---|---|---|
| 10% per started day | 10% of possible per day | 0% | 0 | 0 hours | 100% cap, 0% floor |
| 5% per day with cap | 5% of possible per day | 0% | 0 | 0 hours | 25% cap, 0% floor |
| Exact hourly LMS | 0% | 1% of possible per hour | 0 | 0 hours | 100% cap, 0% floor |
| Flat daily loss | 0% | 0% | 5 points per day | 0 hours | 100% cap, 0% floor |
| 50% floor policy | 10% of possible per day | 0% | 0 | 0 hours | 100% cap, 50% floor |
| Hybrid policy | 5% of possible per day | 0% | 5 points once | 12 hours | 40% cap, 40% floor |
| Rounding rule | Billed hours | Billed days | Best used for | Example at 25 hours late |
|---|---|---|---|---|
| Exact time after grace | Actual hours | Hours / 24 | LMS timestamps and hourly rubrics | 25.00 hours or 1.04 days |
| Round up to started hour | Ceiling of hours | Hours / 24 | Fine-grained online submissions | 25 billed hours |
| Round up to started day | Days x 24 | Ceiling of days | Typical "per day late" syllabus language | 2 billed days |
| One day only after 24 hours | 0 until over 24, then blocks | Whole 24-hour blocks | Policies with a same-day window | 1 billed day |
| Penalty component | Formula | Uses possible points? | Applied before cap? | Applied before floor? |
|---|---|---|---|---|
| Percent per day | possible x daily % x billed days | Yes | Yes | Yes |
| Percent per hour | possible x hourly % x billed hours | Yes | Yes | Yes |
| Flat point loss | flat points x billed units | No | Yes | Yes |
| Penalty cap | minimum(total penalty, possible x cap %) | Yes | No | Before floor |
| Grade floor | do not drop below possible x floor % | Yes | After cap | No |
| Assignment weight | Raw assignment | Adjusted assignment | Assignment drop | Course-grade impact |
|---|---|---|---|---|
| 5% | 92.0% | 72.0% | -20.0 | -1.00 course pts |
| 10% | 92.0% | 72.0% | -20.0 | -2.00 course pts |
| 15% | 92.0% | 72.0% | -20.0 | -3.00 course pts |
| 25% | 92.0% | 72.0% | -20.0 | -5.00 course pts |
This calculator models common classroom late policies for planning. Your official grade depends on the syllabus, instructor policy, gradebook rounding, category setup, and any school-specific rules.
And then there’s that moment on Sunday night. You’re almost done with your work; all that’s left is a couple of minutes before it’s due… Monday morning comes around, and if you hit a snag, your perfect score are on the chopping block. Yes, that’s real fear.
But we know how to avoid it: math. Plug in what’s on your syllabus into the calculator above, and let it do the work for you. No more trying to guess what conversion or coefficient might be.
How to Calculate Late Penalties
Late penalties don’t always work that way. They’re rarely that clean, most student just assume it’s simple subtraction. The catch is knowing which numbers to subtract from each other.
How do you count late? Late per hour? Per day? What does “day” mean? A lot depends off the prof: if he counts by the day you start late, then three minutes will cost you 24 hours. If he’s billing by the minute, those three minutes may dissapears into his grace period. It’s the difference between a 72 and a 92-percent grade. And it won’t matter whether you got 72 or 92, just that you interpreted the word day correctly.
The first line of defense is grace periods. Because life gets in the way, internet lags, technology fails, etc., grace periods soak up some of this messiness by ignoring surge of initial minutes as long as you set one. With a two-hour grace period, if you hit “submit” at 45 min after the due date, clock begins at zero, not at 45. That’s just basic math, but it can save you quite a few points. It does this on purpose to allow for human error.
Next comes the penalty structure. Some teachers has flat point penalties, five points off every single day, no matter how long an assignment was. But many others have a percentage penalty based on how much was potentially available. This is where the calculator up above can do its work. It takes the possible amount (not what you had) and applies that percentage. So if it’s a 100-point test with a 10% penalty, you lose ten points from the top. A grade of 90 becomes an 80. Ouch, right? Yep, it sucks, but it’s meant to.
The safety nets are known as “caps” and “floors.” The “cap” means that no one delay will cause worse than X amount of damage. For example, if your penalty cap is 25%, then you can be as much as a month late before losing a quarter of your points. The “floor,” on the other hand, means that you’ll never fall below a certain point, for instance, with a floor of 50%, you won’t ever recieve a grade of zero. Both features ensure that any given bad week doesn’t blow up your entire semester. They make it possible to know what’s the worst that could happen (and thus lessen your anxiety). If you know your floor, you’ll know how to plan accordingly.
Lastly, we have weight. You might be able to get away with a lower score if there’s no penalty associated with turning in late work, but that’s different than having 25% of your total grade riding on a single assignment. The tool takes into account how much each assignment count toward your final grade. Not only does it tell you what grade you’ll receive on the assignment, but also what happens to your final letter grade. That is crucial, since it will help you determine if begging for an extension is worthwhile or if you should of just take the hit and move on.
Many students don’t see the ripple effect. Instead, they only focus on their next grade in current score. Lose five points on a weighted assignment? You have to make that back somewhere else. And the calculator estimates how well you’ll do in the future so it can show where you’d end up if you’re an eighty-six right now and you intend to average an eighty-eight over the rest of your work. That’s when the calculator help you create reasonable goals. Panic becomes planning.
It’s easy to see in the reference table on the page; it breaks down how various policies rank against each other. How does a lenient daily penalty compare to a strict hourly penalty? How does a percentage loss compare to a flat point loss? This will help when you negotiate with your instructor. Show them the math if you think there was a good reason for being late. Prove to them that, under their current policy, a five day delay is such a large gap that it would be impossible to catch up. Data talks. And data takes the emotion out of the discussion.
Academically, they’re not all as expensive as deadlines are strict. Knowing how lateness works empowers you. It enables you to exactly determine what delaying something costs. It enables you to weigh your priorities when making extension requests. It transforms a panicked situation into a calculated one. Sure, the penalty is there. Sure, the clock is ticking away. But now it’s not guesswork anymore. Now it’s calculation. And that makes all the difference.