Land Value Per Square Foot Calculator
Estimate raw, usable, adjusted, and comparable-normalized land value per square foot for lots, acreage, frontage sites, and development tracts.
📍 Land Scenario Presets
🔢 Parcel Valuation Inputs
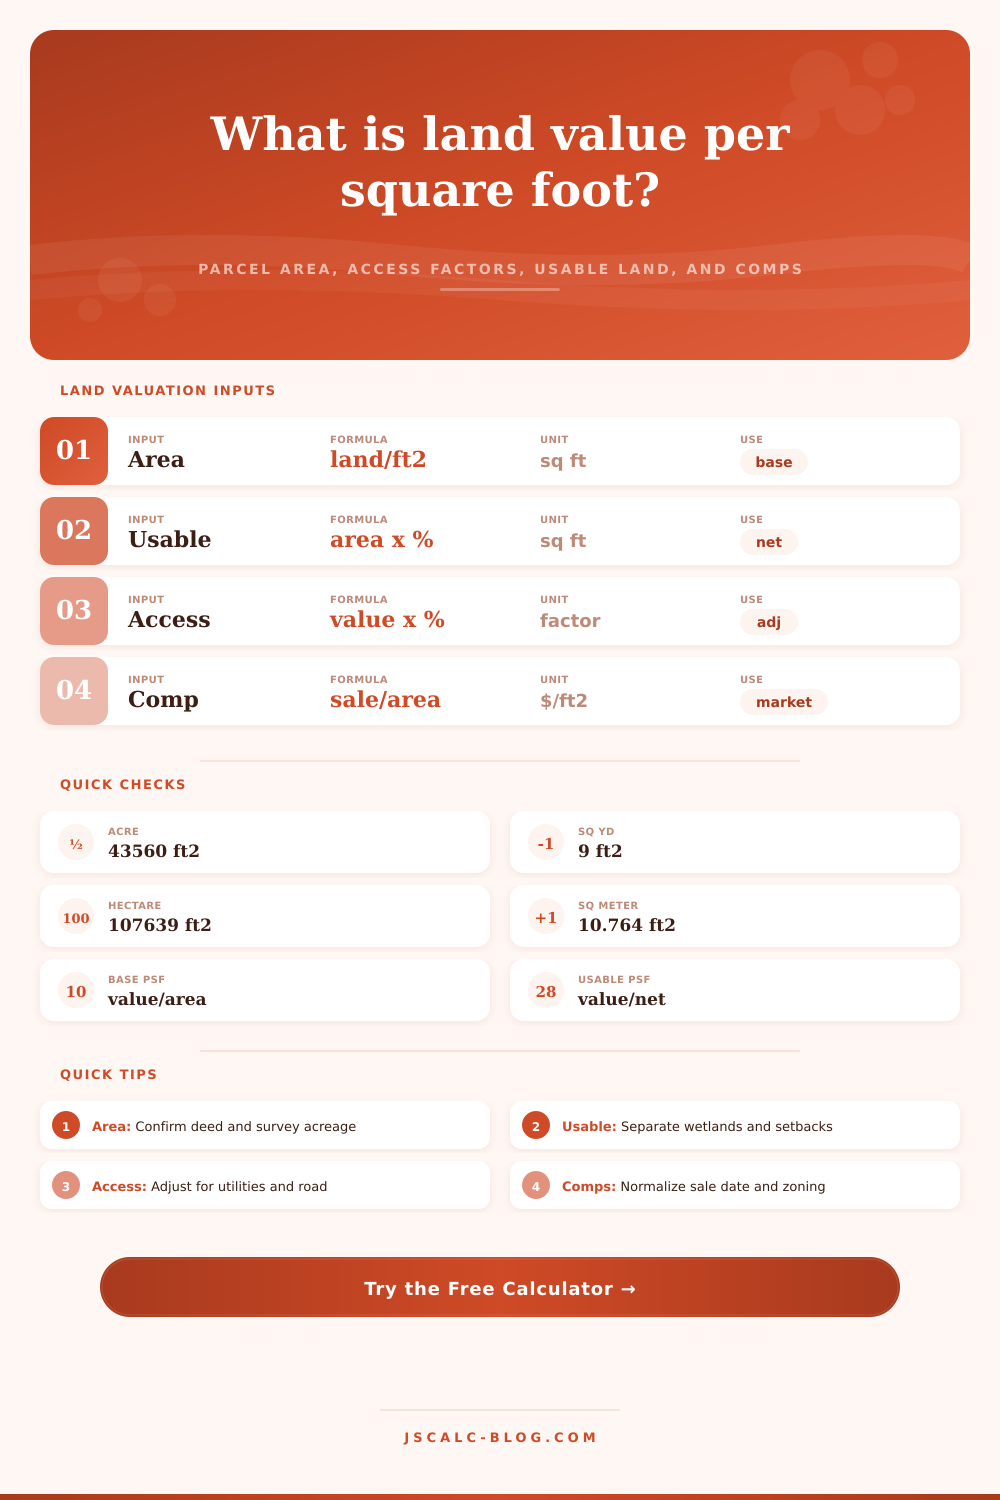
Conversions: acres x 43,560, square yards x 9, hectares x 107,639.104, square meters x 10.7639104.
Net usable area should exclude steep slopes, floodway, wetlands, easements, and required buffers.
Use positive values when the comparable is inferior to the subject; use negative values when it is superior.
Land Value Results
📊 Valuation Checkpoints
🧮 Area Conversion Reference
| Area Unit | Square Foot Formula | Example Input | Converted Area |
|---|---|---|---|
| Square feet | area x 1 | 10,000 sq ft | 10,000 sq ft |
| Acres | acres x 43,560 | 0.25 acre | 10,890 sq ft |
| Square yards | square yards x 9 | 1,200 sq yd | 10,800 sq ft |
| Hectares | hectares x 107,639.104 | 0.10 hectare | 10,764 sq ft |
| Square meters | square meters x 10.7639104 | 1,000 sq m | 10,764 sq ft |
| Frontage x depth | frontage ft x depth ft | 80 ft x 125 ft | 10,000 sq ft |
🏗 Adjustment Factor Guide
| Adjustment Type | Typical Range | Positive Adjustment | Negative Adjustment |
|---|---|---|---|
| Zoning entitlement | -25% to +35% | Higher density, approved use, flexible code | Restrictive overlay, nonconforming use, rezoning risk |
| Utility access | -20% to +15% | Water, sewer, power, gas at or near the site | Well, septic, long extension, capacity uncertainty |
| Road frontage | -15% to +20% | Public road, signalized corner, high visibility | Landlocked, shared easement, limited turning access |
| Usable land | 40% to 100% | Level buildable pad with few buffers | Wetlands, floodway, steep slopes, easements |
| Comparable normalization | -30% to +30% | Comparable inferior to subject after adjustment | Comparable superior to subject after adjustment |
| Market date | -12% to +12% | Market rose after comparable sale date | Market softened after comparable sale date |
🗺 Land Scenario Comparison Grid
| Land Scenario | Common Area | Key Value Driver | Usable Land Watchpoint | Comparable Normalization | Best $/sq ft Basis |
|---|---|---|---|---|---|
| Quarter-acre suburb lot | 0.20 to 0.35 acre | School district, infill location, utility taps | Setbacks and drainage easements | Lot width, depth, and builder demand | Gross sq ft plus usable check |
| 5-acre rural parcel | 3 to 10 acres | Access, septic suitability, privacy, views | Driveway length and perc area | Road type and utility distance | Per acre and gross sq ft |
| Infill city lot | 2,500 to 8,000 sq ft | Allowable units and finished floor area | Alley access and coverage limits | Entitlements and demolition burden | Buildable sq ft and land sq ft |
| Commercial frontage | 0.5 to 3 acres | Traffic counts, visibility, curb cuts | Stormwater, parking, access aisles | Front foot, signal access, corner status | Frontage-adjusted sq ft |
| Farmland acreage | 20 to 160 acres | Soil quality, irrigation, field shape | Wooded, wet, or non-tillable areas | CSR, water rights, crop history | Per tillable acre and sq ft |
| Waterfront parcel | 0.25 to 2 acres | Shoreline quality, dock rights, view | Buffers, flood elevation, erosion | Shoreline feet and view corridor | Usable sq ft plus frontage |
| Industrial pad | 1 to 20 acres | Truck access, utilities, zoning, rail | Pad-ready area and detention | Clear height demand and loading access | Usable pad sq ft |
| Subdivision tract | 10 to 80 acres | Yield, roads, utility extensions, phasing | Open space, ROW, detention, buffers | Lot yield and entitlement stage | Net saleable land sq ft |
📐 Formula Breakdown
| Metric | Formula | What It Shows | When To Use It |
|---|---|---|---|
| Land value per sq ft | land value / land area in sq ft | Raw site value on the entire parcel | First-pass parcel comparison |
| Rectangular area | frontage ft x depth ft | Derived lot area from measured dimensions | Lots described by width and depth |
| Usable land area | square feet x usable land % | Buildable or functional land estimate | Sites with setbacks, wetlands, slopes, buffers |
| Adjustment factor | zoning x utility x road factors | Combined effect of site-specific value drivers | Comparing parcels with different readiness |
| Comparable raw $/sq ft | comp sale price / comp area sq ft | Unadjusted comp sale rate | Checking a comparable sale quickly |
| Normalized comp $/sq ft | raw comp x comp adjustment x date adjustment | Market benchmark adjusted toward subject conditions | Reconciling subject value against comps |
📋 Land Use Reference Ranges
| Land Use Profile | Area Focus | Access Focus | Comp Set Caution |
|---|---|---|---|
| Residential lot | Gross lot and buildable envelope | Street frontage, utilities, school zone | Avoid mixing finished-home residuals with lot sales |
| Rural acreage | Usable homesite plus residual acreage | Driveway, power, well, septic suitability | Separate recreational value from buildable value |
| Urban infill | Buildable floor-area potential | Alley, parking relief, sewer capacity | Normalize entitlement status and demolition needs |
| Retail frontage | Frontage and site plan efficiency | Curb cuts, traffic count, signal proximity | Do not compare interior pads to hard corners directly |
| Agricultural land | Tillable acres and soil productivity | Irrigation, drainage, road access | Wooded acres often need a separate rate |
| Industrial pad | Pad-ready and yard storage square feet | Truck turning, utilities, rail or highway access | Account for detention, easements, and environmental risk |
✅ Valuation Tips
This tool from JSCalc-Blog.com provides calculation support for land analysis. Confirm legal acreage, survey boundaries, zoning, utilities, easements, and market evidence before relying on a valuation.
The “I’m Going To Buy A Piece Of Land Because It’s Pretty”. Turns out half the property is a sheer cliff or wetland; you can’t use it. People fail to distinguish between gross area vs. This is the usable area. They look at the sign saying 2 acre lot, when in fact your buildable area will be radicaly smaller due to steep slopes or wetlands that don’t allow a septic system. Or maybe the county want a buffer next to the creek and you can’t put structures within X distance of water.
No worries, the calculator handles math once you plug in your parcel dimensions and usability percentages. You just enter size of your parcel and % usable space. Why use square foot? Because it’s the basic building block for comparing a big tract of land out in the country to a small piece of property in town. Forty-three hundred and sixty square feet make up one acre. The conversion provides leverage when you’re trying to analyze price per unit of area.
How to Value Land Correctly
What if someone sells you something at a price per acre? That figure could be masking inefficiencies. A five-acre farm might sound more expensive then a quarter-acre suburban lot. However, the farm may have no access to utilities and zero zoning potential, meaning the suburban lot has greater value density. To understand what you’re doing with your money, you’ve got to normalize all of it down to square foot.
Raw land doesn’t arrive primed for building, which means that adjustment factors is critical. Did it come with power? Sewer? Water? Does your drive require 1/4 mile of driveway through a forest? All of those things will directly affect development costs and the tool lets you adjust them in percentages. For example, even if two lots has equally good soil, one may have city sewer and the other requires a well and septic, which is going to impact the price.
Most people overlook that when they compare a list of properties side-by-side. Because no parcel are exactly alike, comparable sales can be tricky. One might sit in a better school district, while another might have superior road frontage. Another has a legal claim for environmental cleanup on it. Others may be located on a nicer street with better road frontage. The calculator provide fields where you can account of such details and make sure you’re adjusting those differences when you don’t merely average the raw sale price.
You want to remove all of the unique elements about comparable properties; i.e., what makes them unique, and establish a baseline rate based purely on land value. Did a comparable sell at $20 per square foot? But it was zoned inferiorly. Adjust it up before comparing it to your property. That keeps you from getting lowballed by bad data, or overpaying due to some overly-inflated comps.
The most subjective piece of information going into any valuation model is probably the % of usable land. You need to be honest with yourself about the shape of the land, easements and survey lines. Is there a significant slope (e.g., over 30%)? Unless you want to pay for retaining walls, you’re not building up there. Do you have a drainage easement running through the center of the lot? That’s right… That’s not part of your usable sq ft. Cut ten or twenty percent off the whole thing, I know it feels like punishing yourself but it reflects reality so embrace it. Otherwise you’ll blow out your budget later as contractors call attention to the blindingly-obvious things you ignored.
It’s not enough to come up with a price that you can afford. It’s about knowing how much value exists in your unique market situation. Total acreage may be more important in one region for hunting potential or agricultural tax breaks. In other regions, frontage width is more important because it affects curb appeal and driveway access. Your breakdown of the comps, adjusted comparables, usable area, gross square footage, gives you a better idea of the dollars-and-cents value breakdown: what are you paying for, and how much?
How do you stop paying for air and start paying for function? What you don’t see is as important (maybe more so) than what you do see when valuing land. You can see what’s above ground but it’s what’s beneath that determines the real value. Whether you’re buying land to build on or hold for income, basing your purchase on adjusted square footage instead of raw acres helps shield you from paying too much for undeveloped land. It simplifies an otherwise complicated math problem and guarantees each dollar spent will contribute something tangible, not merely looks.
You should of checked the soil first.