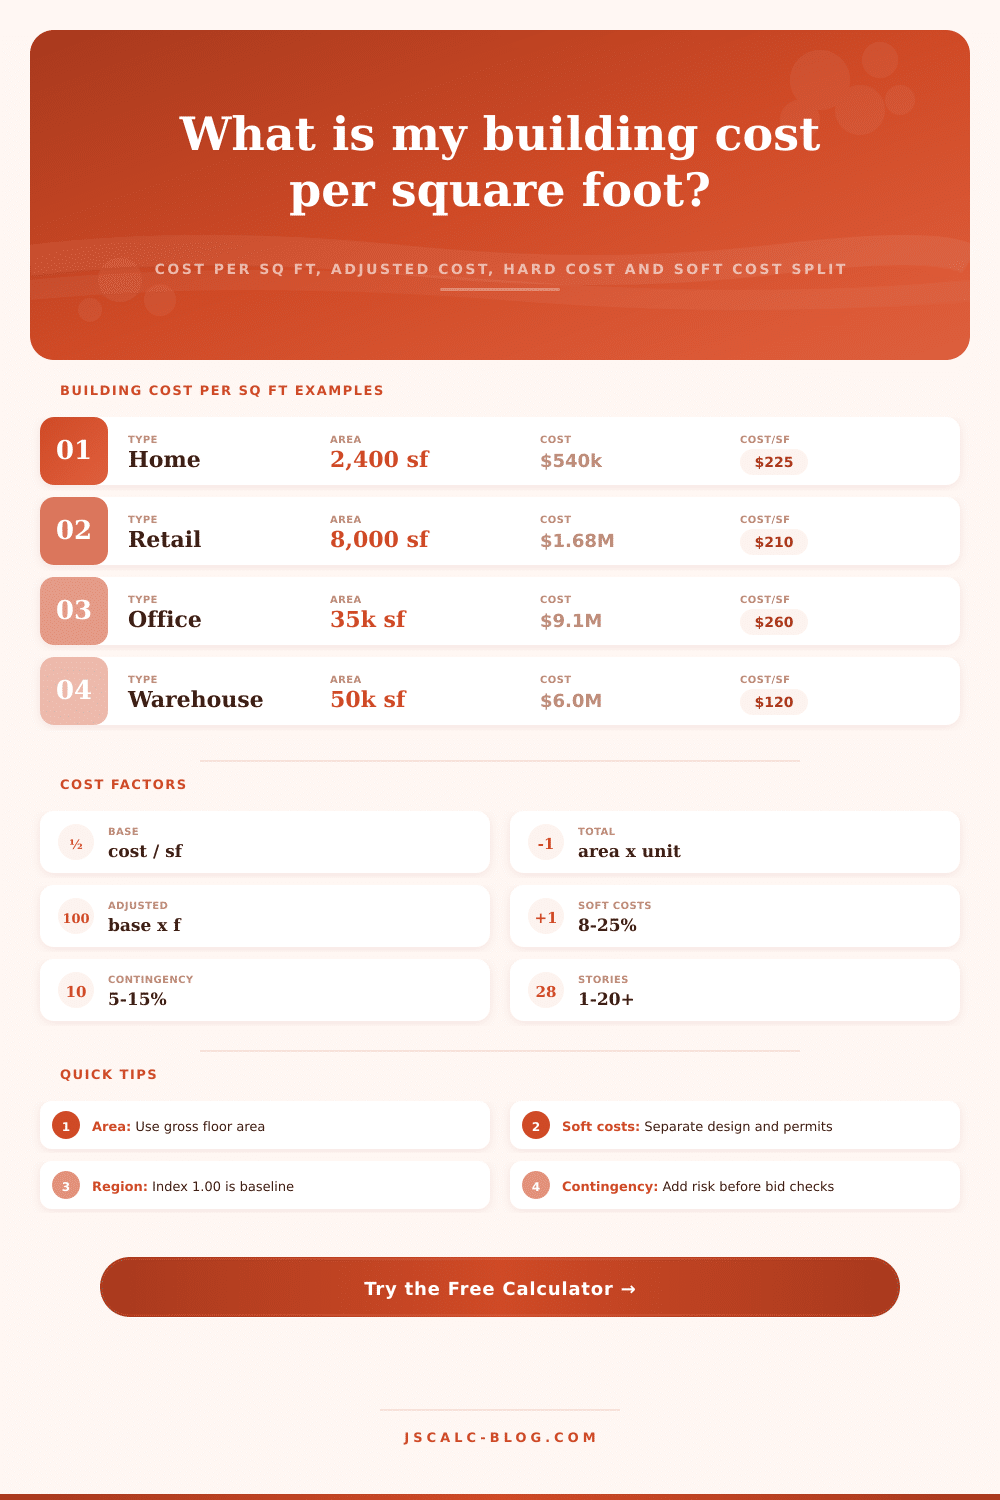
Building Cost Per Square Foot Calculator
Compare base cost, adjusted cost, hard cost, soft cost, contingency and story-level intensity from one gross floor area estimate.
Reference ranges vary by market and specification; use the calculator factors to normalize a project before comparing rows.
| Building Type | Typical Area | Base Cost / ft² | Soft Cost % | Contingency % | Complexity Range |
|---|---|---|---|---|---|
| Single-family home | 1,800-4,500 ft² | $170-$300 | 10%-18% | 7%-12% | 0.95-1.25 |
| Custom residence | 3,000-8,000 ft² | $300-$650 | 14%-24% | 10%-18% | 1.15-1.60 |
| Retail shell | 5,000-40,000 ft² | $140-$280 | 8%-16% | 6%-12% | 0.90-1.25 |
| Warehouse | 20,000-250,000 ft² | $85-$170 | 7%-14% | 5%-10% | 0.80-1.15 |
| Medical office | 10,000-80,000 ft² | $350-$750 | 14%-25% | 10%-18% | 1.20-1.80 |
| School addition | 15,000-120,000 ft² | $260-$520 | 12%-22% | 8%-15% | 1.05-1.45 |
| Urban apartments | 40,000-300,000 ft² | $240-$520 | 12%-24% | 8%-16% | 1.15-1.70 |
| Hotel | 45,000-250,000 ft² | $230-$520 | 13%-24% | 8%-16% | 1.10-1.65 |
| Quality Class | Quality Factor | Typical Scope | When To Use | Cost Sensitivity |
|---|---|---|---|---|
| Economy | 0.88 | Simple finishes and standard systems | Basic occupancy or shell work | Low to moderate |
| Standard | 1.00 | Common finishes and typical MEP | Baseline estimate | Moderate |
| Enhanced | 1.18 | Better envelope, finishes and controls | Above-average specification | Moderate to high |
| Premium | 1.38 | High finish level and tighter tolerances | Custom or image-sensitive projects | High |
| Institutional | 1.28 | Durable assemblies and public review | Schools, civic and assembly spaces | High |
| Specialized | 1.55 | Labs, medical, data or mission-critical systems | Heavy MEP or regulated programs | Very high |
| Cost Bucket | Common Range | Formula In Calculator | Included Examples | Review Trigger |
|---|---|---|---|---|
| Hard cost | 65%-85% | Total - soft - contingency | Trades, materials, equipment, site work | Scope drawings change |
| Soft cost | 8%-25% | Total x soft cost % | Architecture, engineering, permits, testing | Entitlement or design effort expands |
| Contingency | 5%-15% | Total x contingency % | Estimating risk, escalation buffer, unknowns | Early design or difficult site |
| Adjusted cost | Variable | Base x complexity x region x quality | Location, difficulty and specification | Compare projects in different markets |
| Input Unit | Conversion | Example Area | Gross Floor Area | Cost Per ft² Use |
|---|---|---|---|---|
| Square feet | 1 ft² = 1 ft² | 10,000 ft² | 10,000 ft² | Direct calculation |
| Square meters | 1 m² = 10.7639 ft² | 1,000 m² | 10,764 ft² | Convert first |
| Two-story gross area | Total area / stories | 20,000 ft² / 2 | 10,000 ft² plate | Story check only |
| Benchmark unit cost | Area x unit cost | 25,000 x $220 | 25,000 ft² | $5,500,000 total |
People generally start from a price per square foot and finish baffled; they take that number at face value when in fact it means very little by itself. To know how much something costs requires knowing where on the planet it is, and what exactly is being included. That’s why this calculator exists: to push beyond the headline number to cost drivers.
You input gross floor area and total budget, but its the adjustment factors which actualy make a difference. But what about the inputs? More than you’d guess. Probably the most common mistake people make at first: they don’t realize that the labor cost in Oklahoma City is different from the labor cost in San Francisco (even though the brickwork may look identical). You can move that regional index around on a sliding scale, from 1.00 (the default baseline) based off the state of your local market, and then that becomes a nice multiplier between accurate guesses and inaccurate ones.
How To Use The Cost Calculator
Next comes complexity: If you have odd soil conditions or a really steep slope, the exact same square feet will cost you more than normal. Give it a difficulty score, give it another one, and the calculator do the math for you.
The other big variable is quality class. It’s not just about space, it’s about system intensity and finish level. A specialized spec (like a lab) require tighter tolerances and heavier MEP systems, while an economy spec use basic mechanicals and materials. The calculator breaks out those levels so you can get a sense of the real cost of your design decisions. And once you do, seeing the hard number assigned to those shiny fixtures makes it easy to settle for good enough.
Budgets can leak through a line item called soft costs. These include financing, legal work, permits, and engineering and architect fee. None of these involve nails in wood, but they all keep the project alive. Before it spits out the number for hard construction costs, the tool let you assign a percentage to these soft items. Depending on what kind of project it is, you’ll typically use between eight and twenty-five per cent for soft costs, so without accounting for that bucket, you lose your contingency overnight. Ten per cent is a good starting place for most typical projects as insurance against the unexpected; contingency itself isn’t wasted money.
Finally, there’s that thing at the bottom of the tool which break it down for you and acts as a sanity check. You can see amount for hard costs, soft costs (and why that might be), and contingency reserves. All of these categories help you see where something has gone wonky. For instance, if your overall project cost is sky high, but your hard cost per square foot seems normal, look at the soft cost percentage; perhaps design took longer than anticipated, or permits ran up a higher bill then expected.
The reference table on the page lays this out clearly for different building types: warehouses are cheap to build per square foot because they are simple boxes, while medical offices is expensive because every room needs specialized infrastructure. This is where we generally use gross floor area. All enclosed level get counted. The story count is used to check if the average floor plate is realistic. A 10,000 square foot house on two stories has a footprint of five-thousand square feet. And that makes a difference when it comes to how things sit on site as well as how they’re made to stand. Normalizing projects based off those elements will give you a fair comparison. Otherwise, you are simply comparing apples to oranges wrapped in different pricing models.
We’re looking for accuracy, not cost. Underestimating (i.e. Running out of money) bring work to a screeching halt; overestimating stings less. It’s like this: this tool provides structure to otherwise fuzzy estimates. It gives you visibility into everything, which allows you to make smart decisions before you sign on the dotted line. That is worth more than any price tag in a spreadsheet.