KD Ratio Calculator
Work out your kill/death ratio, KDA with assists, kills and deaths per match, your skill tier, and exactly how many kills you still need to reach a target KD across FPS games like Warzone, CS2, Valorant, and Apex Legends.
🎯Real KD Presets
📝Match Stats
Set to 0 for a flawless, no-death record.
Used in KDA and KDA-half modes.
Drives kills and deaths per match.
Used by the target-KD mode.
🔢Formula Snapshot
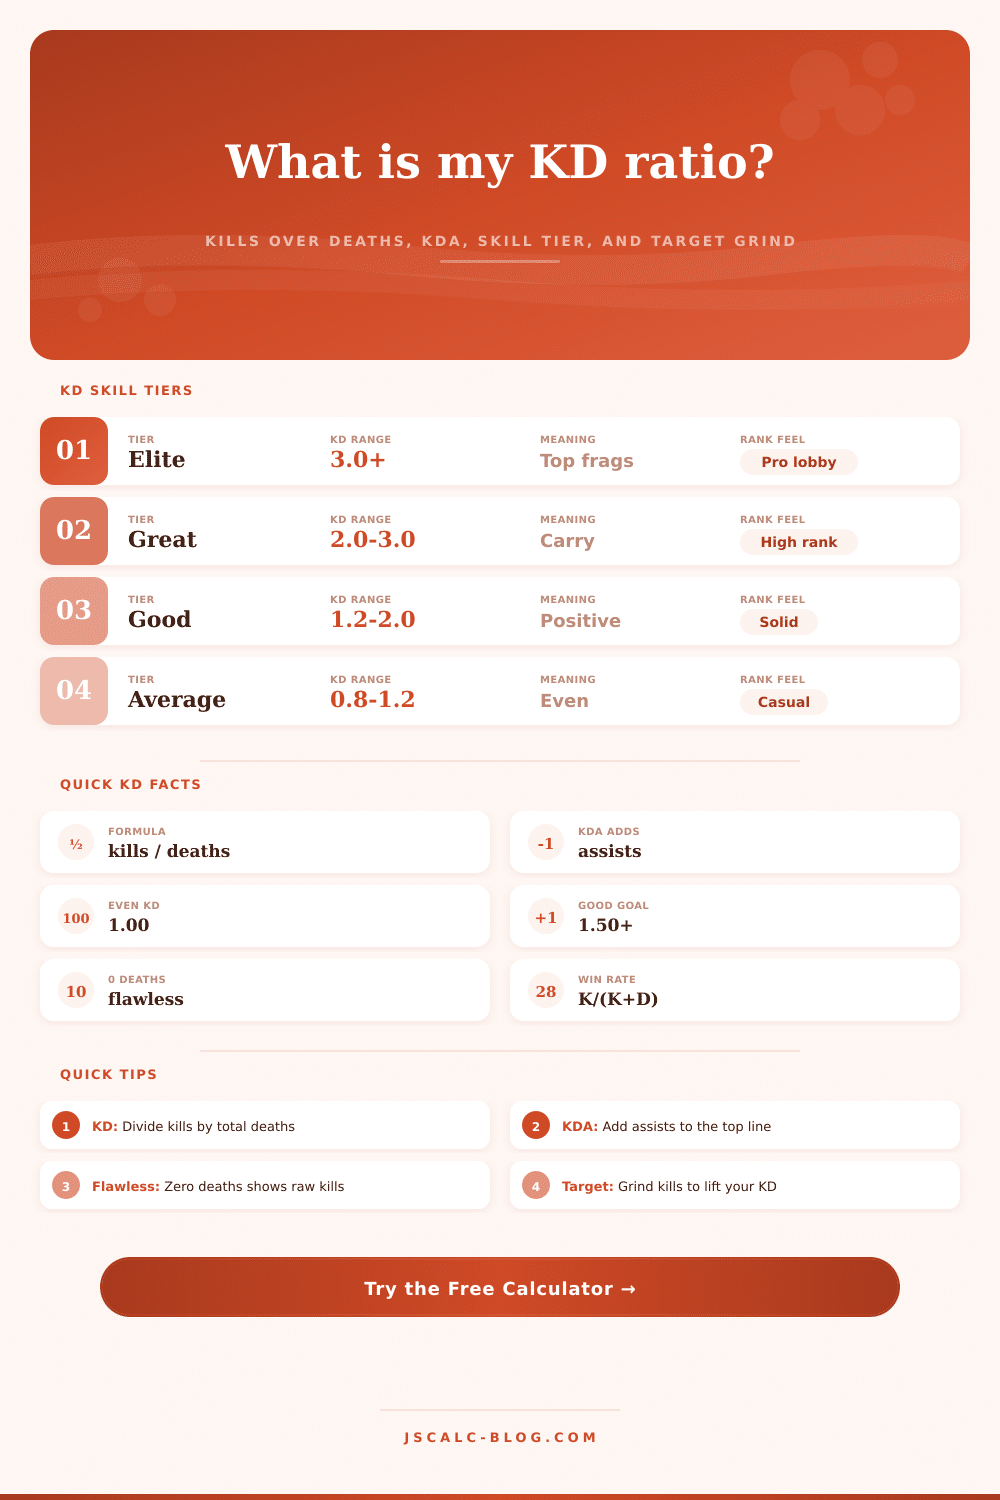
🏆KD Skill Tier Reference
| Tier | KD Range | What It Means | Typical Lobby |
|---|---|---|---|
| Below Average | Under 0.80 | More deaths than kills each life | Learning the game |
| Average | 0.80 to 1.20 | Roughly even trades overall | Casual and quickplay |
| Good | 1.20 to 2.00 | Positive, wins most 1v1s | Solid ranked player |
| Great | 2.00 to 3.00 | Carries lobbies regularly | High ranked |
| Elite | 3.00 and up | Top-frag most matches | Pro and top 1% |
🧮KDA Formula Reference
| Metric | Formula | Counts Assists? | Best Used In |
|---|---|---|---|
| KD ratio | kills ÷ deaths | No | Warzone, CS2, classic FPS |
| KDA (full) | (kills + assists) ÷ deaths | Yes, full value | Apex, team-based modes |
| KDA (half) | (kills + assists÷2) ÷ deaths | Yes, half value | MOBA-style scoring |
| Flawless KD | kills (deaths = 0) | No | No-death games |
| Gunfight win % | kills ÷ (kills + deaths) | No | Duel win-rate context |
🎯Kills Needed For Target KD
| Target KD | At 100 Deaths | At 150 Deaths | At 200 Deaths | Idea |
|---|---|---|---|---|
| 1.00 | 100 kills | 150 kills | 200 kills | Break even |
| 1.50 | 150 kills | 225 kills | 300 kills | Solidly positive |
| 2.00 | 200 kills | 300 kills | 400 kills | Great tier |
| 2.50 | 250 kills | 375 kills | 500 kills | Carry level |
| 3.00 | 300 kills | 450 kills | 600 kills | Elite tier |
🗂Game Comparison Grid
| Game | Primary Metric | Even Line | Good KD | Elite KD | Assist Weight |
|---|---|---|---|---|---|
| Warzone | KD ratio | 1.00 | 1.30+ | 2.50+ | Not in KD |
| CS2 | KD ratio | 1.00 | 1.15+ | 1.60+ | Tracked apart |
| Valorant | KD + KDA | 1.00 | 1.10+ | 1.50+ | Half often used |
| Apex Legends | KDA ratio | 1.00 | 1.50+ | 3.00+ | Full assists |
| Fortnite | KD ratio | 1.00 | 2.00+ | 5.00+ | Solo has none |
| Rainbow Six | KD ratio | 1.00 | 1.10+ | 1.50+ | Tracked apart |
⚙Full Formula Breakdown
📋Reference Values
| Stat | Common Range | How It Is Used | Effect On KD |
|---|---|---|---|
| Kills | Any positive count | Top of the KD fraction | More kills raise KD |
| Deaths | 0 or more | Bottom of the KD fraction | More deaths lower KD |
| Assists | 0 to many | Added to top for KDA only | No effect on plain KD |
| Matches | 1 or more | Divides kills and deaths | Drives per-match pace |
| Target KD | 0.5 to 5.0 | Goal for kills-needed math | Higher goal, more kills |
💡Practical KD Tips
Maybe you play a lot of shooter games and feel like you’ve got a sharper edge now. Maybe you’re placing your crosshairs with more precision then ever before. More precise than they were a month ago. But all those numbers in your career statistics don’t seem to add up to your ego, and that leaderboard standing never seem to budge.
What’s the difference? That gap is typicaly a single, easily quoted but rarely understood measure. Kills to deaths (KDR) are not simply a vanity number. It’s a measurement of efficiency. Simply input your totals into calculator above; it will do the math for you and strip out the noise to show you exactly where you are on that ladder.
Understanding Your Kill Death Ratio
It’s simple division. Total kills divided by total deaths. Twenty kills, ten deaths? Your ratio is two point zero. On paper that looks pretty good which means you’re surviving twice as often than you are eliminated. Sounds like you’ve turned into some kind of badass.
But the numbers shifts with type of gameplay. A one point five ratio might make you one of the best in the game if you play a strategic five against five shooter where individual survival is paramount. Or maybe it seem just average if you play a free-for-all battle royale with a hundred other people, where high kill counts are easier to achieve in open fields. It isn’t so much about actual number as knowing how that number fits within a given context.
Many players forget about assists, but they show a completely different picture of what you bring to the team. It’s easy to switch between regular KD and KDA (which incorporates assists). That’s when the discussion becomes active amongst competitive communities. A few games heavily value assists since it incentivizes damage dealing and objective play regardless of who scores the last hit. Others considers assists completely useless. Before you get too hard on yourself or too easy on yourself, make sure to understand which side of fence your game falls on. The site has a handy reference table explaining how different games views a good assists score compared to a mediocre one.
Getting better isn’t usually about getting more kills. You’re almost always going to have to die less. Most people assume that if their number’s low, all they need to do is be more aggressive. But no, in fact, they need to stop engaging poorly and play smarter rotations. There’s a feature in the calculator where you can type in any ratio and it’ll tell you how many extra kills you’d need to achieve that. When you see that number, it can be shocking. You might be trying to go from one point zero to two point zero and still have a lot of deaths, so the amount of kills you’d need to haul in can seem impossible. That frustration will serve its purpose by making you realize that the only way forward is to cut your deaths. This denominator is dragging the whole thing down with each death.
People argue a lot about skill tiers online, and while that’s subjective to an extent, there are some broad metrics that apply to nearly any competitive shooter. One point zero is a fair tradeoff with other players. Below it mean you’re taking more fights at a loss. Above it means you’re helping the team win more matches. Three point zero or so is generally considered elite territory, meaning you’re routinely outplaying the average player in the lobby. That takes more than just aiming skills; it also takes patience, map familiarity, and game sense.
The math aggregates every brilliant play and every bad decision into a single decimal point and doesn’t lie about your consistency. When you track it over time it tells you so much more then any one snapshot will ever show you. Sure, a player might be on an insane kill streak which drives up his average but masks how poorly he’s played lately. Likewise, a couple really bad losses can totally tank a rising ratio while masking a week or two of killer play. The average per match that the tool provides help to even out those swings and give you a better idea of where you’re at today instead of where you were during your best moment. This is what matters for long term improvement.
Rather than getting all spun out about one stinker of a game, you see the trend line, and let that tell you how you’re doing. That change in mentality makes all the difference between stagnation and growth.
Numbers are ultimately just feedback. This feedback tells you what your habits have led you to and how much or how little you’re working with. No amount of numbers can ever define how good or bad of a player you are. Trust them if they tell you that you’re struggling, enjoy the validation if they tell you that you’re carrying. Use them as a way to focus your practice, on those things which pull the needle the other way.
If you want your performance to be flawless or simply don’t wish to feel like bottom feeder anymore, the better you understand what the ratio really represents, the more you can play with purpose instead of frustration.