Discounted Cash Flow Calculator
Discount a stream of future yearly cash flows back to present value, add an optional terminal value, and read net present value, discount factors, and discount-rate sensitivity from the standard DCF formula.
🎯Real DCF Presets
📝Cash Flow Inputs
Ignored in custom mode; that list sets the year count.
Year 1 amount for equal and growing modes.
Applied in growing mode: CF grows each year.
Cash out at time zero. Set 0 for pure PV.
Optional exit or residual value in the last year.
Used only in custom mode. Example: 12000, 15000, -4000, 30000.
🔢Formula Snapshot
📊Year-by-Year Discounting
| Year (t) | Cash Flow | Discount Factor | Present Value | Cumulative PV |
|---|---|---|---|---|
| Enter values above to build the year-by-year discounting schedule. | ||||
📉NPV vs Discount Rate Sensitivity
| Discount Rate | PV of Cash Flows | Terminal PV | Net Present Value | Verdict |
|---|---|---|---|---|
| The sensitivity table appears after calculation. | ||||
The rate where net present value crosses zero is the internal rate of return (IRR) for this cash flow stream.
🗂Discount Factor Reference by Rate & Year
| Year (t) | 4% Rate | 6% Rate | 8% Rate | 10% Rate | 12% Rate | 15% Rate |
|---|---|---|---|---|---|---|
| 1 | 0.9615 | 0.9434 | 0.9259 | 0.9091 | 0.8929 | 0.8696 |
| 2 | 0.9246 | 0.8900 | 0.8573 | 0.8264 | 0.7972 | 0.7561 |
| 3 | 0.8890 | 0.8396 | 0.7938 | 0.7513 | 0.7118 | 0.6575 |
| 5 | 0.8219 | 0.7473 | 0.6806 | 0.6209 | 0.5674 | 0.4972 |
| 7 | 0.7599 | 0.6651 | 0.5835 | 0.5132 | 0.4523 | 0.3759 |
| 10 | 0.6756 | 0.5584 | 0.4632 | 0.3855 | 0.3220 | 0.2472 |
🗂DCF Scenario Comparison Grid
| Scenario | CF Pattern | Years | Rate (r) | Initial Cost | Terminal |
|---|---|---|---|---|---|
| 5-year business | Growing 8%/yr | 5 yr | 12% | $120k | $150k exit |
| Rental property | Rent minus costs | 10 yr | 8% | $250k | Resale value |
| Startup valuation | Steep growth | 7 yr | 25% | $500k | Exit multiple |
| Bond cash flows | Fixed coupons | 10 yr | 6% | Price paid | Face value |
| Equal annuity | Level $10k/yr | 5 yr | 10% | $35k | None |
| Project NPV | Uneven per year | 6 yr | 10% | $60k | Salvage value |
⚙Full Formula Breakdown
📋DCF Terms Reference
| Term | Meaning | How It Is Used | Effect on NPV |
|---|---|---|---|
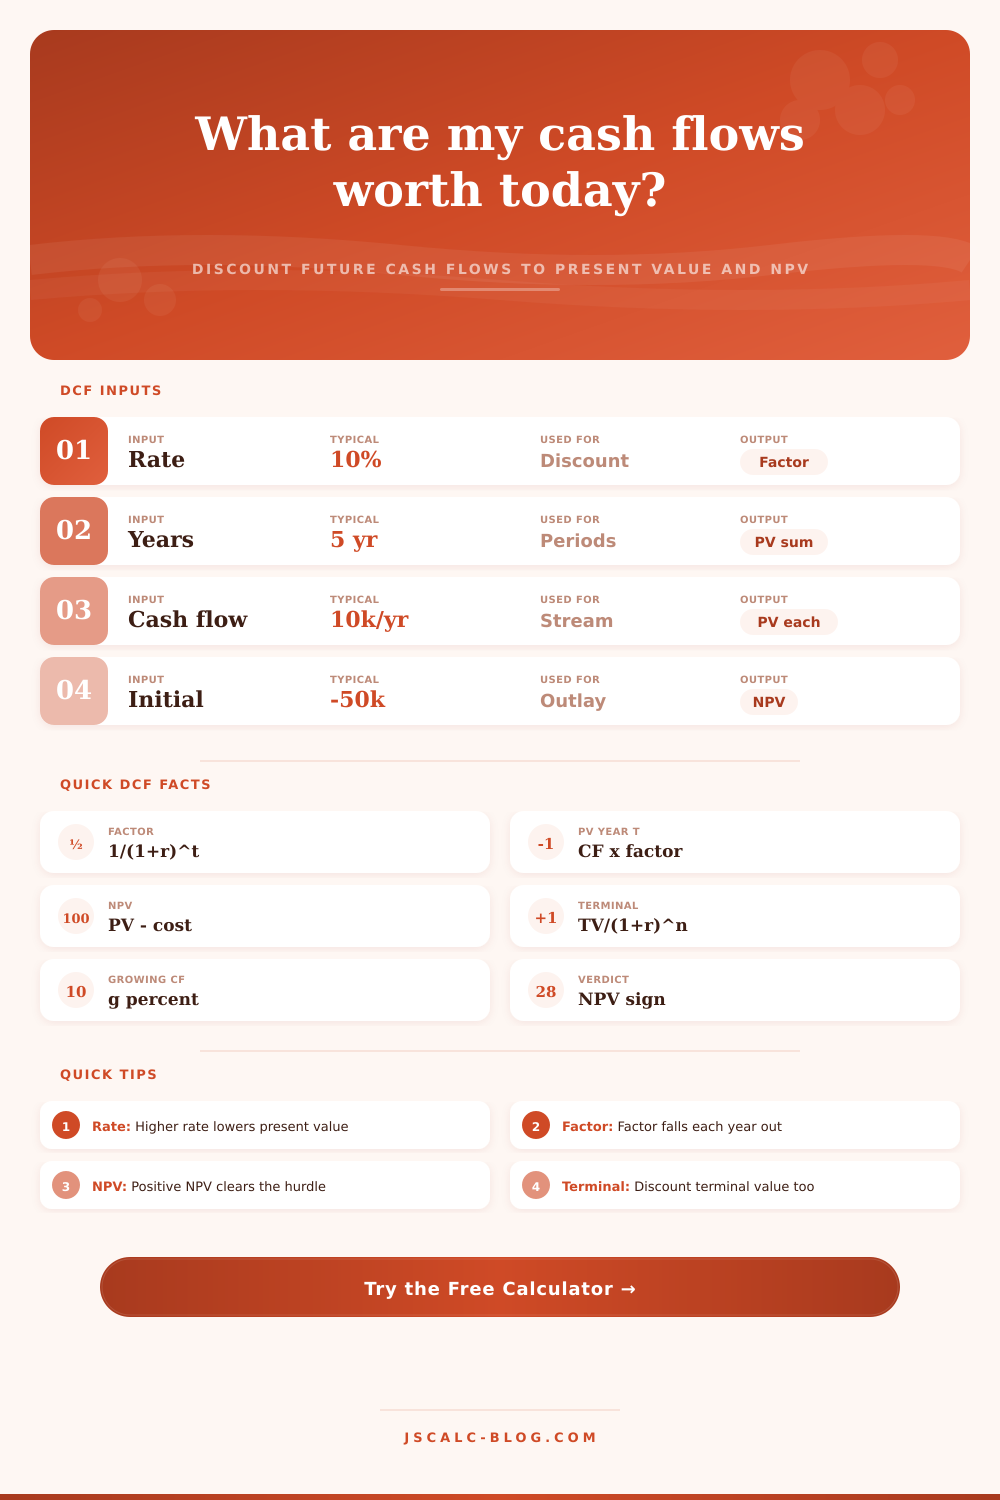
| Discount rate (r) | Required annual return | Drives 1 / (1 + r)^t | Higher rate lowers NPV |
| Present value (PV) | Today value of one CF | CF × discount factor | Adds into total PV |
| Net present value | PV of flows minus cost | Total PV – initial cost | Sign is the accept rule |
| Terminal value (TV) | Exit or residual value | TV / (1 + r)^n | Can dominate long models |
| Growth rate (g) | Yearly CF growth | CF × (1 + g)^(t – 1) | Raises later cash flows |
| WACC | Blended cost of capital | Common choice for r | Sets the hurdle rate |
💡Practical DCF Tips
When you spend versus save today, you might have a hunch that one dollar today is worth more than one dollar tomorrow. That’s because the dollar today has more buying power than the dollar you’ll be paid tomorrow. To quantify this difference, we convert time into numbers. Discounted cash flow analysis calculates a single present value figure which eliminates uncertainty about what lies ahead. It answers: Is this a good use of my capital right now?
This all depends on one key factor: the discount rate. This is what we call the weighted average cost of capital or WACC. It are the interest rate you would expect if you took on same amount of risk but received different returns. If an investment is very speculative, requiring a 10% per year return, then receiving cash in Year Five is worth less now than getting cash tomorrow. Conversely, a small shift in that rate can cause massive swings in value.
How Discounted Cash Flow Works
Fortunately, the calculator makes these calculations for you without forcing you to fiddle with fractional powers and exponents. Because of compound growth, slight variations in discount rate make huge differences in outcome. Switching from an eight percent to a twelve percent discount over ten years won’t merely lower profits; it will wipe them out completely.
The second aspect is speed. How fast are those cashflows? Generally, they don’t come steadily at all but gradually ramp up from small amounts then stabilize. This is where the tool realy shines, you’re able to input actual cashflow streams, either in annuity fashion or something wild like this: high-low-high-peak-plateau-slow-decline-steady-bang! Add a terminal value for period beyond your project horizon.
Over time, that exit number will dominate the total outcome, so remain skeptical to keep your analysis true. Future promises are converted into present value. Each predicted dollar is multiplied by decreasing factor that decreases with increasing time horizon. At a modest interest rate, it’s only about one-half of the original factor by year ten. You can see the decline yourself in the yearly breakdown presented by the calculator… The weights applied to each period sits right there on the table.
That’s what you’ll notice when you look at those numbers and understand why real-world valuation so frequently favor short-term cash over long-term promise. That’s the final verdict, net present value. It simply takes your initial cost and discounts it into the future. Then, it subtracts that figure from total amount of money you’ll receive in the future. If the answer is positive, that means the deal adds theoretical wealth and meets your personal hurdle rate. If the answer is negative, that means required return is too high to be worth those future payouts.
The binary signal eliminates emotion from your investment decisions. It forces you to define “success” before spending a single penny. The second mistake is choosing an overly-optimistic discount rate or failing to account for the fact that a model will be highly sensitive to a variable’s change. The interface includes a sensitivity table that plots out how fast net present value goes negative at higher rates.
This is helpful feedback on whether you have a project with some margin for error if, say, financing costs are suddenly higher then expected, or inflation spikes. Think of this as risk mapping more than fortune telling. It’s not that you’re trying to predict what will happen exactly. You’re outlining what needs to be true for it to become okay to move forward. Force yourself to be specific about these variables (opportunity cost, growth expectations, exit strategy). These details would of otherwise hide beneath fuzzy emotions.
Once you do this, the math take over and does the heavy lifting without any hesitation or bias. But that’s fine, making a better decision doesn’t require perfect information. It only requires consistently applying some logic to similar choices. If it’s a startup equity investment, a corporate expansion proposal, or a rental property, it all follows the same framework. Discount future cash back to present-day terms. Subtract immediate costs. Whatever’s left tells you whether the risk is worth taking.
And as long as math adds up in-between, the one dollar in your hand will beat the far-off promise.