2000m Row DPS Calculator
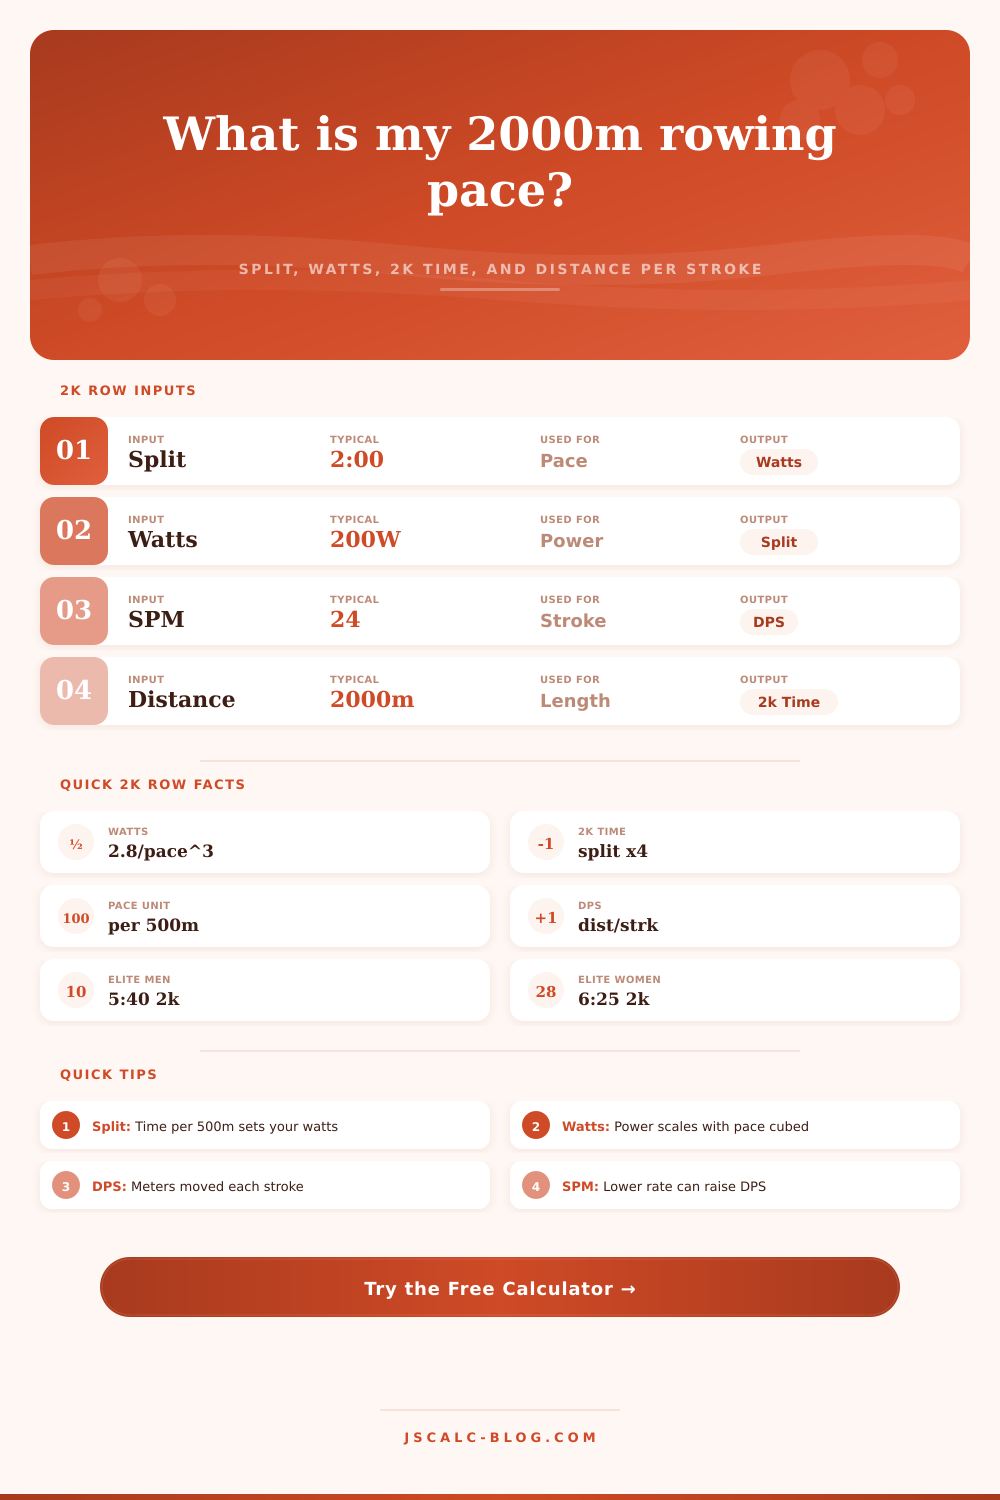
Convert your Concept2 erg numbers into a 500m split, average watts, projected 2k time, boat speed, and distance per stroke using the official Concept2 power formula watts = 2.80 / pace cubed.
🚣Real 2k Row Presets
📝Row Inputs
Used when input method is from 500m split.
Used when input method is from total time.
Used when input method is from watts.
Used for the watts-per-kilogram readout only.
🔢Formula Snapshot
📊Split to Watts Reference
| 500m Split | Watts | 2000m Time | Boat Speed | Cal / Hour |
|---|---|---|---|---|
| 1:30 | 480 W | 6:00 | 5.56 m/s | 1155 |
| 1:40 | 350 W | 6:40 | 5.00 m/s | 898 |
| 1:45 | 302 W | 7:00 | 4.76 m/s | 803 |
| 1:50 | 263 W | 7:20 | 4.55 m/s | 725 |
| 2:00 | 203 W | 8:00 | 4.17 m/s | 605 |
| 2:10 | 159 W | 8:40 | 3.85 m/s | 518 |
| 2:20 | 128 W | 9:20 | 3.57 m/s | 456 |
| 2:30 | 104 W | 10:00 | 3.33 m/s | 408 |
🏅2k Time Benchmarks By Level
| Level | Men 2k | Men Split | Women 2k | Women Split |
|---|---|---|---|---|
| Elite / national team | 5:40 | 1:25 | 6:25 | 1:36 |
| Advanced competitor | 6:20 | 1:35 | 7:10 | 1:47 |
| Strong club rower | 6:50 | 1:42 | 7:45 | 1:56 |
| Fit recreational | 7:30 | 1:52 | 8:30 | 2:07 |
| Steady beginner | 8:30 | 2:07 | 9:30 | 2:22 |
| New to rowing | 9:30 | 2:22 | 10:30 | 2:37 |
🔁Stroke Rate and DPS Reference
| Split | Speed | 18 SPM | 22 SPM | 26 SPM | 30 SPM |
|---|---|---|---|---|---|
| 1:45 | 4.76 m/s | 15.9 m | 13.0 m | 11.0 m | 9.5 m |
| 1:50 | 4.55 m/s | 15.2 m | 12.4 m | 10.5 m | 9.1 m |
| 2:00 | 4.17 m/s | 13.9 m | 11.4 m | 9.6 m | 8.3 m |
| 2:10 | 3.85 m/s | 12.8 m | 10.5 m | 8.9 m | 7.7 m |
| 2:20 | 3.57 m/s | 11.9 m | 9.7 m | 8.2 m | 7.1 m |
| 2:30 | 3.33 m/s | 11.1 m | 9.1 m | 7.7 m | 6.7 m |
⚙Full Formula Breakdown
🗂Pace and Distance Comparison Grid
| Split | Watts | 500m | 1000m | 2000m | 5000m | Cal / Hr |
|---|---|---|---|---|---|---|
| 1:35 | 404 W | 1:35 | 3:10 | 6:20 | 15:50 | 1017 |
| 1:45 | 302 W | 1:45 | 3:30 | 7:00 | 17:30 | 803 |
| 1:52 | 249 W | 1:52 | 3:44 | 7:28 | 18:40 | 691 |
| 2:00 | 203 W | 2:00 | 4:00 | 8:00 | 20:00 | 605 |
| 2:10 | 159 W | 2:10 | 4:20 | 8:40 | 21:40 | 518 |
| 2:20 | 128 W | 2:20 | 4:40 | 9:20 | 23:20 | 456 |
| 2:30 | 104 W | 2:30 | 5:00 | 10:00 | 25:00 | 408 |
📋Input Reference Values
| Input | Common Range | How It Is Used | Effect On Output |
|---|---|---|---|
| 500m split | 1:20 to 2:40 | Divided by 500 for pace | Drives watts, 2k time, speed |
| Average watts | 80 to 480 W | Inverted to find pace | Sets split and 2k projection |
| Stroke rate | 18 to 34 SPM | Multiplied by total minutes | Changes distance per stroke |
| Piece distance | 500 to 10000 m | Total time = split × distance / 500 | Sets total strokes and DPS |
| Body weight | 50 to 110 kg | Divides watts for W/kg | Readout only, not pace |
💡Practical Rowing Tips
At some point in a hard piece, you glance over to your erg monitor and have one of those moments. You think: the distance per stroke has stalled out. The stroke rate feel high and the watts feel low. The split time look good. Am I spinning my legs faster or am I working smarter? In most cases, that’s because you’ve got numbers on that screen in your head as distinct entities, not inter-related components of one very real piece of machinery.
Pace, power, and efficiency are fixed. It’s governed by fluid dynamics and they don’t give a hoot about how tired you might be. Indoor rowing math doesn’t forgive. It’s cubic at its heart. Your power output doesn’t increase direct with your speed. It increases with the cube of your speed. If you want to cut ten seconds off each of your 500-meter splits, amount of force necessary to do that is disproportionately large. That jump from a two-minute split to a one-fifty split is no minor step up in terms of physical effort.
Understanding Rowing Numbers
The calculator will spit out that math for you instantly and show you exactly how much more watts it’ll take to hold that faster pace, which lets you know whether or not the extra effort is worth it. As folks attempt to chase faster times, most vastly underestimate how steep wattage rises. That’s where efficiency comes in: Stroke rate and distance per stroke.
Recreational rower tend to make one key mistake: thinking they go faster when their stroke rate goes up. That’s usually not the case unless you’re already putting out a lot of power at a moderate stroke rate. When you crank up strokes per minute but don’t also increase your drive force, you reduce distance per stroke. Your average speed then won’t improve; you’ll be churning water rather than going anywhere. With this tool you can toggle back and forth between the variables and easily see the tradeoff. Keep your split constant and lower your stroke rate; now look up and see distance per stroke number climb. Each pull become more effective.
Without benchmarks to put those raw numbers into perspective. Having some idea of how hard you’re working is good… “I’m pushing out two-hundred watts.” That’s fine, but if you know that correlates to a decent-for-you sub-eight-minute-twenty klick then that puts it all in real world terms. Those are broken down from elite to novice levels (see below) in the reference table on the page, so you can see where you fit against larger norms. It is not so much a “beat-the-guy-to-your-left” thing as it is seeing what the ceiling is on your existing ability.
Momentum also matters: bodyweight impacts that on an air resistance ergometer (unlike when cycling or running), but it doesn’t affect power output as directly as it does elsewhere. So don’t let watts per kilogram throw you off when comparing yourself to other athletes at varying weights; it can be useful as a comparison metric, but keep in mind the ultimate objective here is maxing out total force production in a race piece. Do I have the engine for this thing? That’s what you wanna know, whatever size of fuel tank you’re pulling with.
The calorie count displayed on the monitor is also an estimate based off time and power output. Not to be mistaken for accurate calories to eat or burn, they’re good indicators of total caloric burn but not exact dietary goals. Based on the mechanical work performed against the air flywheel, it’s a standard industry approximation used by most companies. Your metabolism will pay some price for high-level work you’re doing. This provide a ballpark figure for your metabolic cost. You can plan out your nutrition/nutrition recovery around heavy training blocks with this in mind.
So in summary, the value of rowing data comes down to whether or not you use it for help on how to row and how to set your pacing plan. Treat the inputs as an opportunity to try various combinations of split and stroke rate until you discover the sweet spot of greatest distance covered per stroke at a manageable level of effort. When you’re able to flow with the pace, the numbers will reflect it; when you force the pace, the numbers will let you know. This transition from feeling to knowing is what distinguishes good rower from great rowers.
Once you understand the cubic relationship between power and speed, you can move past guesswork and begin to design your performance. You should of known that earlier.