Infant Growth Percentile Calculator
Estimate weight-for-age, length/height-for-age, and head-circumference-for-age percentiles and z-scores for babies 0 to 36 months using the WHO and CDC LMS method with a normal-curve conversion.
🎯Real Baby Presets
📝Baby Measurements
Choose which measure the four result cards score.
Subtracts weeks early from age up to 24 months.
🔢LMS Method Snapshot
📊Median Reference by Age and Sex
| Age | Boy Wt kg | Girl Wt kg | Boy Len cm | Girl Len cm | Boy Head cm | Girl Head cm |
|---|---|---|---|---|---|---|
| Median (50th percentile) reference values load on calculation. | ||||||
📏Estimated Percentile Curve for This Baby
| Percentile | Z-Score | Weight kg | Length cm | Head cm | Band |
|---|---|---|---|---|---|
| The 3rd to 97th percentile values for this age and sex appear after calculation. | |||||
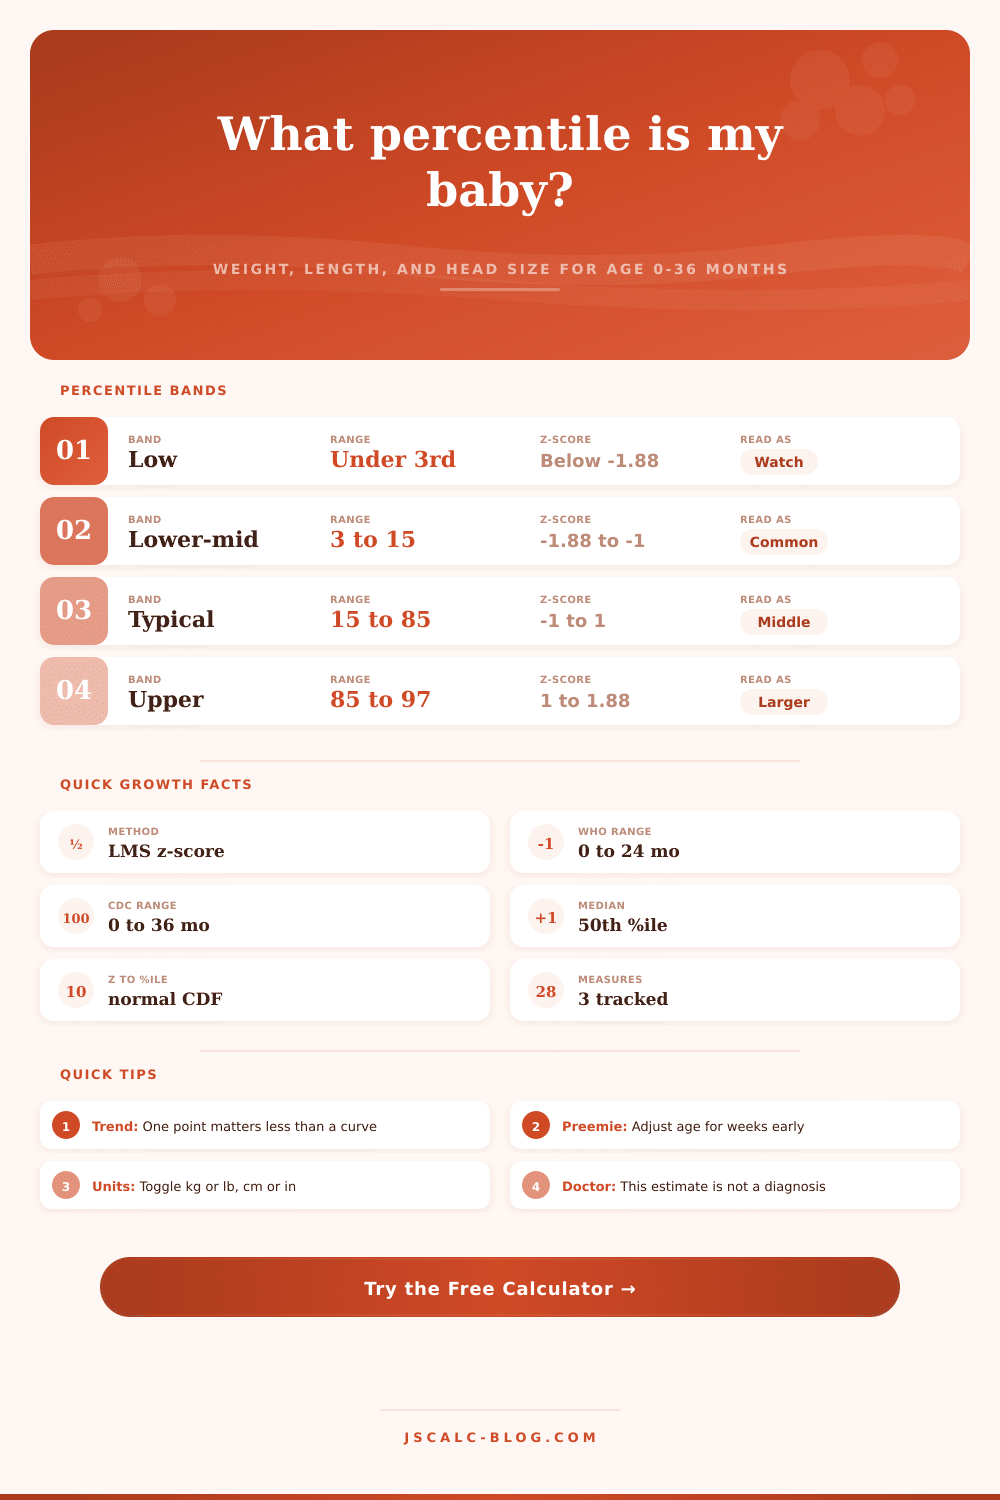
📐Percentile Band Interpretation
| Band | Percentile Range | Z-Score Range | Roughly Means |
|---|---|---|---|
| Below 3rd | Under 3rd | Below -1.88 | Smaller than most; discuss trend |
| 3rd to 15th | 3 to 15 | -1.88 to -1.04 | Lower-middle, still very common |
| 15th to 85th | 15 to 85 | -1.04 to 1.04 | Broad typical middle range |
| 85th to 97th | 85 to 97 | 1.04 to 1.88 | Upper-middle, larger than most |
| Above 97th | Over 97th | Above 1.88 | Larger than most; discuss trend |
🗂Z-Score to Percentile Reference
| Z-Score | Percentile | Z-Score | Percentile |
|---|---|---|---|
| -3.0 | 0.1 | +0.5 | 69.1 |
| -2.0 | 2.3 | +1.0 | 84.1 |
| -1.88 | 3.0 | +1.04 | 85.0 |
| -1.04 | 15.0 | +1.5 | 93.3 |
| -1.0 | 15.9 | +1.88 | 97.0 |
| -0.5 | 30.9 | +2.0 | 97.7 |
| 0.0 | 50.0 | +3.0 | 99.9 |
🚀Typical Growth Velocity Reference
| Age Window | Weight Gain | Length Gain | Head Gain | Feeds Note |
|---|---|---|---|---|
| 0 to 3 mo | ~170-227 g/wk | ~3.5 cm/mo | ~2 cm/mo | Fastest phase |
| 3 to 6 mo | ~113-142 g/wk | ~2 cm/mo | ~1 cm/mo | Solids may start |
| 6 to 9 mo | ~85-113 g/wk | ~1.5 cm/mo | ~0.5 cm/mo | More solids |
| 9 to 12 mo | ~57-85 g/wk | ~1.2 cm/mo | ~0.5 cm/mo | Often near double birth wt |
| 12 to 24 mo | ~1.5-2.5 kg/yr | ~1 cm/mo | ~0.25 cm/mo | Appetite slows |
| 24 to 36 mo | ~2 kg/yr | ~0.7 cm/mo | Very slow | Toddler pattern |
🗃Scenario Comparison Grid
| Scenario | Sex | Age | Measure | Value | Approx %ile |
|---|---|---|---|---|---|
| Newborn median | Girl | 0 mo | Weight | 3.2 kg | ~50th |
| Chunky 3-month | Boy | 3 mo | Weight | 6.0 kg | ~10th |
| Tall 6-month | Girl | 6 mo | Length | 68 cm | ~75th |
| One-year boy | Boy | 12 mo | Weight | 9.6 kg | ~50th |
| Two-year girl | Girl | 24 mo | Length | 86 cm | ~50th |
| Head at 3 months | Boy | 3 mo | Head | 40.5 cm | ~50th |
| Large baby | Boy | 6 mo | Weight | 9.0 kg | ~90th |
| Small baby | Girl | 6 mo | Weight | 6.4 kg | ~10th |
⚙Full Formula Breakdown
💡Practical Growth Tips
Remember holding your newborn? They felt so small in your arms. They was very dependent on you to keep them alive.
Often, that same sensation persists at the well baby visit. You wait as pediatrician marks your baby’s growth on a chart. As the dot moves across the paper, up or down, sometimes your heart race when the dot isn’t where it should be. It’s terrifying, but the numbers are actualy more stable than you realize.
How To Read Baby Growth Charts
Head Circumference: This tool calculates where your child falls on the growth curve for weight, length, and head circumference (based off the LMS method which accounts for the fact that not all kids grow linearly). Based on expected variations and medians for their age/sex, it will calculates what is known as a z-score.
Why is this important? Because if you have a 3 month old who has been growing rapidly, that is different then having an older toddler plateau out. Instead of giving you rough guesses, this thing use interpolation between its set of reference ages to give you super accurate estimates.
The first thing most parents look for is if their baby is above or below the average line. That’s where confusion typically begins. If your kid is at tenth percentile, it doesn’t mean something is wrong; if they are at the ninety-eighth, it doesn’t mean they’re healthier by default. It only tells you how he or she compare to a big reference population. This will appear both as a percentile rank and a category band on the calculator.
If a baby fall somewhere in the middle of categories, they track along normally. One near the ends has a different kind of genetic blueprint. What doctors is looking at is the trend line, not a dot on it. Is your baby maintaining a general growth pattern around the 15th percentile in terms of weight during his/her first year? They are probably just growing along a normal path. And it’s when a child drop sharply over two large percentile lines (without obvious medical cause) that it gets worrisome. Same goes for head size and length, key measure of your tot’s total development.
Age correction is key for preemies. Because a baby born six weeks prematurely will be labeled as “smaller” in terms of their chronological age, this take into account how their size compare developmentally. This levels the playing field, so to speak, right up until around two years old, at which point most preemies hit even with full term kids. This is a simple mathematical adjustment that could of save parents from worrying unnecessarily and give them some peace of mind.
And then there’s knowing your units and standards. Breastfed babies grows in an ideal way, at least as measured by charts from the World Health Organization. Data from the Centers for Disease Control and Prevention draws from U.S. Surveys that include formula-fed babies. The data comes from surveys of mostly formula-fed baby. Depending on what standard you use, you may notice a little variance, but it’s good to know where that comes from. With the calculator, you can switch back and forth to compare results.
The charts are simply snapshots in time. They don’t capture a strong smile, alertness, or joy. Take them with a grain of salt. If your baby is meeting milestones, feeding well, and growing steadily on the curve, the specific percentile doesn’t realy matter.
Go back to that moment when you held your little one for the first time. That’s all the confirmation you need that he/she is growing into it.