Horsepower Per Pound Calculator
Enter horsepower and vehicle weight to get power-to-weight in HP per pound, pounds per horsepower, HP per ton, and metric kW per kg, plus a rough 0-60 mph estimate.
🏎Real Vehicle Presets
📝Power and Weight Inputs
Enter rated crank HP. Wheel loss is applied below if selected.
Added to weight regardless of the unit above.
Applied only when HP is measured at the crank.
🔢Ratio Snapshot
📊Power-to-Weight Benchmarks by Class
| Vehicle Class | HP / lb | lb / HP | HP / ton | Feel |
|---|---|---|---|---|
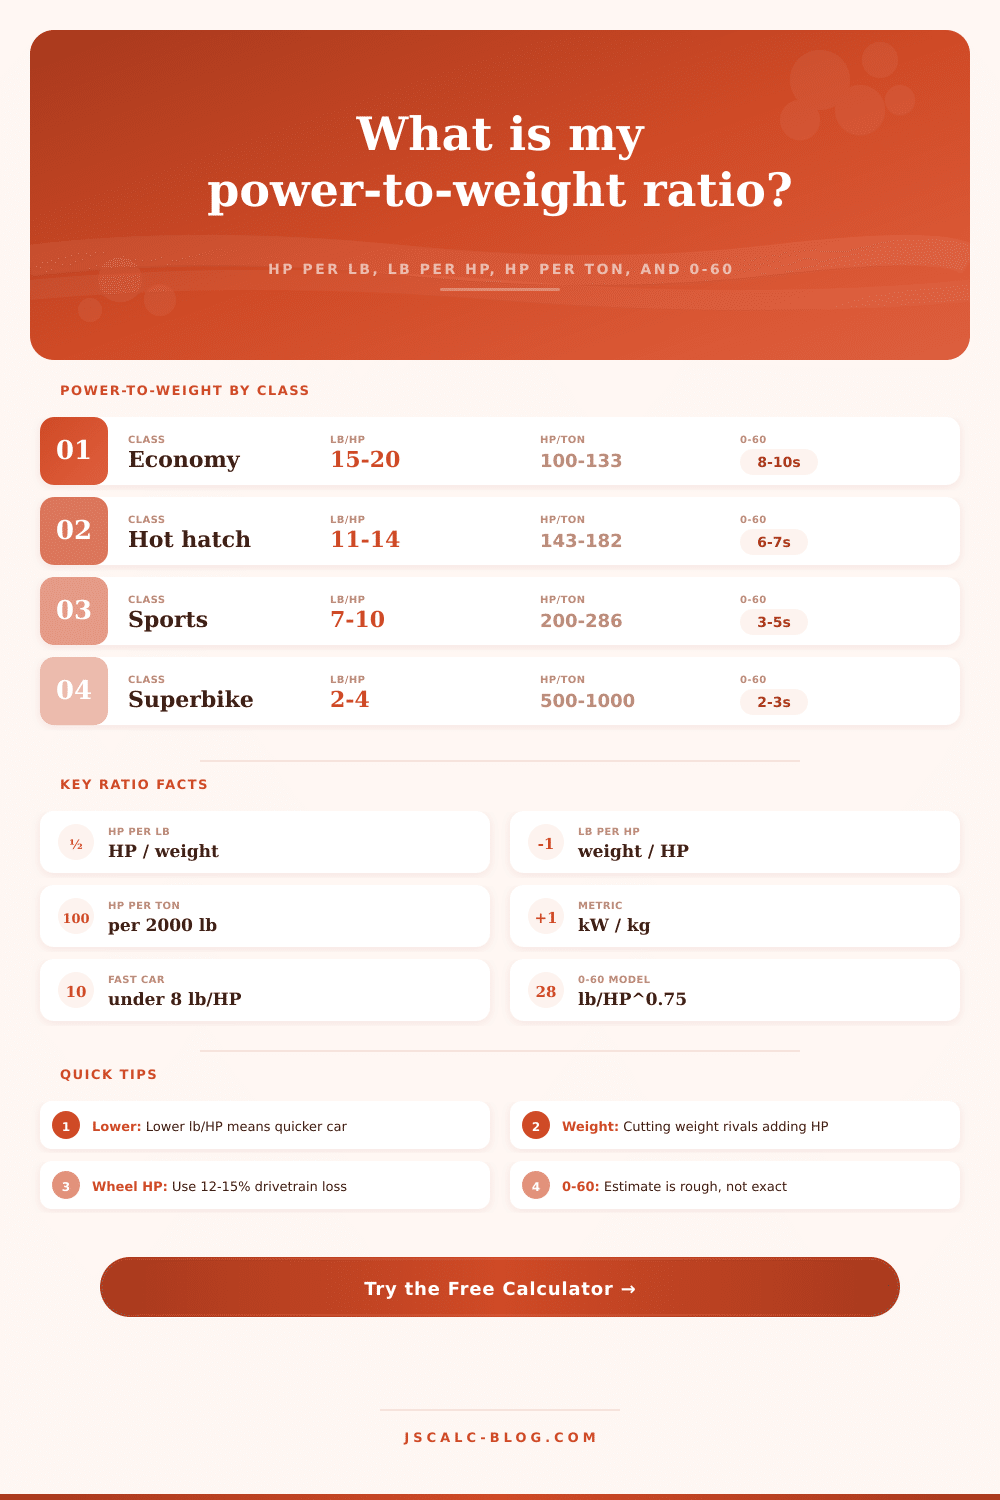
| Economy commuter | 0.05 – 0.067 | 15 – 20 | 100 – 133 | Relaxed |
| Family sedan | 0.06 – 0.083 | 12 – 16 | 125 – 167 | Adequate |
| Hot hatch / warm | 0.071 – 0.091 | 11 – 14 | 143 – 182 | Lively |
| Sports car | 0.10 – 0.143 | 7 – 10 | 200 – 286 | Fast |
| Supercar | 0.143 – 0.25 | 4 – 7 | 286 – 500 | Brutal |
| Superbike | 0.25 – 0.5 | 2 – 4 | 500 – 1000 | Extreme |
🎯Pounds Per HP Performance Tiers
| lb / HP | Tier | Rough 0-60 | Typical Example |
|---|---|---|---|
| Over 20 | Slow / heavy | 11 s and up | Loaded van, base truck |
| 15 – 20 | Economy | 9 – 11 s | Compact commuter |
| 11 – 14 | Warm | 6.5 – 8 s | Hot hatch, sport sedan |
| 8 – 10 | Quick | 4.5 – 6 s | Sports coupe, muscle |
| 5 – 7 | Very quick | 3 – 4.5 s | Supercar, pro EV |
| Under 5 | Elite | Under 3 s | Hypercar, superbike |
🚗Vehicle Comparison Grid
| Vehicle | HP | Weight lb | HP / lb | lb / HP | HP / ton | Est 0-60 |
|---|---|---|---|---|---|---|
| Mazda MX-5 Miata | 181 | 2341 | 0.077 | 12.93 | 154.7 | ~5.8 s |
| Honda Civic Si | 200 | 2952 | 0.068 | 14.76 | 135.5 | ~6.4 s |
| VW Golf GTI | 241 | 3150 | 0.077 | 13.07 | 153.0 | ~5.8 s |
| Ford F-150 5.0 | 400 | 4900 | 0.082 | 12.25 | 163.3 | ~5.6 s |
| Chevy Corvette C8 | 495 | 3535 | 0.140 | 7.14 | 280.1 | ~3.7 s |
| Tesla Model 3 Perf | 450 | 4048 | 0.111 | 9.00 | 222.4 | ~4.4 s |
| Dodge Hellcat | 707 | 4451 | 0.159 | 6.30 | 317.7 | ~3.4 s |
| Liter superbike | 200 | 430 | 0.465 | 2.15 | 930.2 | ~1.5 s |
| Semi (bobtail) | 500 | 25000 | 0.020 | 50.00 | 40.0 | ~16 s |
| Racing go-kart | 15 | 350 | 0.043 | 23.33 | 85.7 | ~9.0 s |
Est 0-60 uses the same rough model as the calculator (crank HP). Real times vary with traction, gearing, and aerodynamics. Bikes and karts beat the model due to grip and short gearing; semis are torque and gear limited.
⚙How the Math Works
📋HP Per Ton Reference Examples
| Segment | Typical HP | Typical Weight | HP / ton |
|---|---|---|---|
| City car | 90 HP | 2400 lb | 75.0 |
| Midsize SUV | 250 HP | 4300 lb | 116.3 |
| Muscle car | 460 HP | 3900 lb | 235.9 |
| Track special | 500 HP | 3000 lb | 333.3 |
| Formula-style | 750 HP | 1600 lb | 937.5 |
| Top fuel (extreme) | 11000 HP | 2320 lb | 9482.8 |
💡Power-to-Weight Tips
In automotive circles, there’s an idea that a vehicle’s acceleration comes down to horsepower only. I’ve seen people say on message boards, “My engine has X horsepower now. Mine goes faster then yours.” They ignore the fact that they have massive sound deadening and heavy wheels installed onto a heavy frame.
In reality, it’s simpler than that, and it gets more annoying to the gearhead who fixate on peak horsepower numbers. Force is king but mass are equally important; the most consistent indicator of actual acceleration isn’t horsepower, but how much power there is compared to weight. There is no marketing bullshit. It is just pure physics.
Why Weight Matters More Than Horsepower
This means we don’t have to do the arithmetic. We just plug in our vehicle’s rated horsepower and curb weight into the calculator on this page and it spit out the numbers: pounds per horsepower, kilowatts per kilogram, and an estimated zero-to-sixty time. But what do these numbers mean? That’s where the magic happens, not with the raw data, but behind the scenes with the physics of motion.
According to Newton’s second law, force equal mass times acceleration. If you double your engine power but also double your weight, your acceleration stay the same. The size of the badge on the grille doesn’t matter; neither does the sound of the exhaust. It’s all math.
For every day driving, however, the more immediate unit of measurement has to be Pounds Per Horsepower (PPHP). It’s the simplest way to tell how well you’re doing… Less is more. In other words, it’s an efficiency measurement. Each pound of vehicle mass demand a share of the engine’s output to move forward.
So if you’ve got twenty pounds per horsepower, you’re in Economy Car Land where highway merges feel sluggish but still comfortabley. Bring those numbers down to ten pounds per horsepower and the vehicle come alive. The response to your right foot isn’t hesitant anymore; it’s urgent. And this change isn’t just about speed, it’s about engagement.
For example, it’s easier to lose weight than to add power, since shedding mass will improve all aspects of the dynamic driving experience, including straight-line acceleration. Losing weight also improves braking, handling balance (cornering flatter), and tire wear. Taking away three hundred pounds from a three-thousand-five-hundred-pound vehicle will provide the same percentage increase in performance as adding, say, forty horsepower at the crankshaft. But the mechanical challenge of reducing weight is less than the task of increasing horsepower.
Removing a set of spare wheels and replacing heavy steel components with aluminum doesn’t require adjusting your fuel map, nor does it compromise engine durability. The secret is understanding that each pound removed perform greater work than each horsepower added.
To put things in perspective, it has a list of reference tables which categorizes vehicles by their performance class. That way, you can compare your setup to something that is already known. So an 8 pound/hp ratio is pretty solid for a track focused sports car. Twelve pounds per horse for a family sedan fits right there. When we move to racing motorcycles and supercars, they will test that definition by going even lower. Often, you won’t even know what those numbers represent. It’s good to check that against your own stuff so that you don’t fall down the rabbit hole and think you’re getting more bang for the buck just because it sounds cool on a spec sheet.
These are approximate zero-to-sixty estimates using empirical equations. No consideration was made for gearing details, traction limits or aerodynamic drag, so take these as ballpark estimates and not exact predictions. A car with grippy tires on the rears will do better than this model predicts; likewise, one that is fighting for grip (such as a front wheel drive) may be slower.
If you know your power figure is measured at the crankshaft, then the tool has consider the drivetrain loss. This is an important correction because not all rated horsepower makes it to the pavement. Fifteen percent off for differential and transmission losses should of paint a more realistic view of how much the wheels can produce.
But really, it all boils down to this: finding the right balance between reality and your own expectations. Is it more important to have a quick response in everyday driving situations, or are you looking for top-end speed? Most of the time, the answer isn’t to buy a larger engine, it’s to shed unnecessary weight, and make use of whatever power you’re already working with better.
Respect the mass you’re trying to propel, and stop chasing maximum horsepower; then you’ll find yourself seeing a clear picture of what “performance” actualy means. And sometimes, throwing less force at something that weighs less can be every bit as exhilarating as throwing more force at something that weighs more.