Horsepower Calculator 1/4 Mile
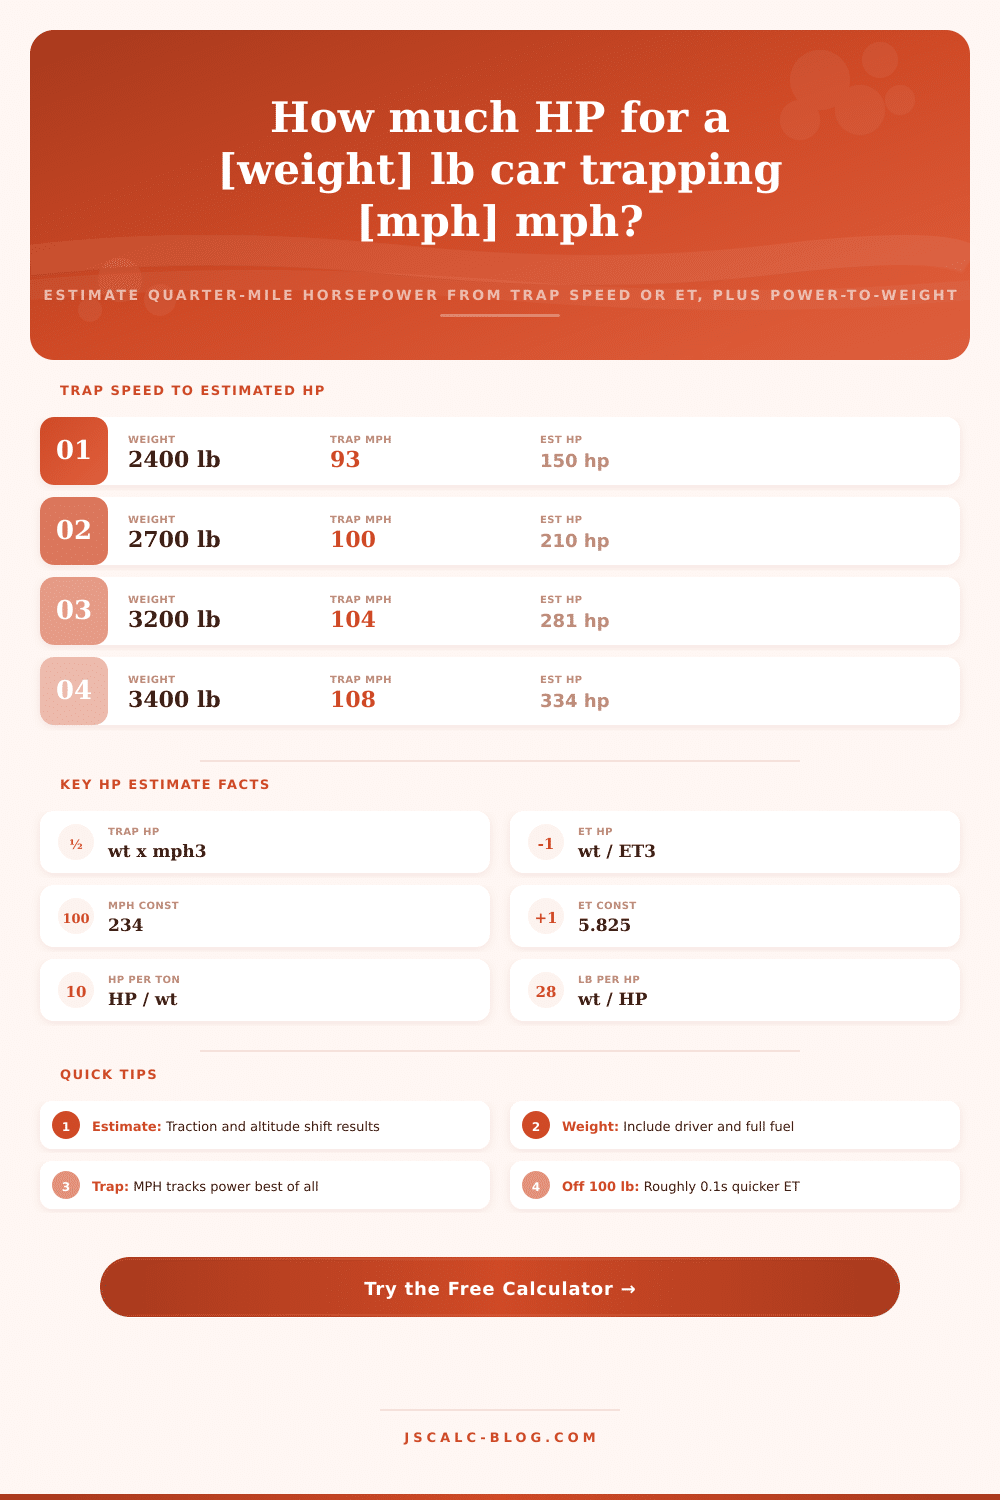
Estimate engine horsepower from quarter-mile drag strip numbers. The trap-speed model uses HP = weight x (mph / 234) cubed, and the ET model uses HP = weight / (ET / 5.825) cubed. Enter your vehicle weight with driver, then a trap speed or elapsed time, and read estimated power, power-to-weight, and a reverse prediction. These are empirical estimates, not dyno figures.
🏎Choose Input Method
🚗Real Drag Strip Presets
📋Vehicle & Run Inputs
Race weight including driver, fuel, and gear.
Kg is converted to pounds for the models.
Speed as the car crosses the 1/4 mile line.
Full quarter-mile elapsed time from a dead stop.
Divisor in HP = weight x (mph / constant) cubed.
Constant in HP = weight / (ET / constant) cubed.
Predicts trap speed and ET this power should run.
Controls decimals shown on the result cards.
🔢Model Constants Snapshot
🏁Trap Speed to Estimated HP
| Vehicle Weight | Trap Speed | Estimated HP | Feel |
|---|---|---|---|
| 2,400 lb | 93 mph | 150 hp | Light hot hatch |
| 2,700 lb | 100 mph | 210 hp | Warm sport compact |
| 3,200 lb | 104 mph | 281 hp | Strong V6 coupe |
| 3,400 lb | 108 mph | 334 hp | Muscle sedan |
| 3,800 lb | 112 mph | 417 hp | Modern pony car |
| 4,000 lb | 118 mph | 513 hp | Supercharged V8 |
| 4,200 lb | 122 mph | 595 hp | Big-power bruiser |
| 4,500 lb | 125 mph | 686 hp | Hellcat class |
⏱ET to Estimated HP (3,500 lb)
| Elapsed Time | Est HP at 3,500 lb | Typical Trap | Class |
|---|---|---|---|
| 16.0 s | 169 hp | 86 mph | Economy car |
| 15.0 s | 205 hp | 93 mph | Daily commuter |
| 14.0 s | 253 hp | 99 mph | Quick street car |
| 13.0 s | 315 hp | 105 mph | Fast street car |
| 12.0 s | 401 hp | 113 mph | Serious muscle |
| 11.0 s | 521 hp | 121 mph | Track weapon |
| 10.0 s | 694 hp | 131 mph | Race build |
| 9.0 s | 952 hp | 144 mph | Full drag car |
⚖Power to Weight Feel Guide
| lb per HP | HP per Ton | 0-60 Feel | Example |
|---|---|---|---|
| 20 lb/hp | 100 hp/ton | 8-9 sec | Base commuter |
| 15 lb/hp | 133 hp/ton | 6-7 sec | Warm hatch |
| 12 lb/hp | 167 hp/ton | 5-6 sec | Sport sedan |
| 10 lb/hp | 200 hp/ton | 4.5 sec | Muscle car |
| 8 lb/hp | 250 hp/ton | 3.8 sec | Sports car |
| 6 lb/hp | 333 hp/ton | 3.0 sec | Supercar |
| 5 lb/hp | 400 hp/ton | 2.6 sec | Hypercar |
📊Weight vs Trap Speed HP Grid (constant 234)
| Weight | 95 mph | 105 mph | 115 mph | 125 mph | 135 mph |
|---|---|---|---|---|---|
| 2,800 lb | 187 hp | 253 hp | 332 hp | 427 hp | 537 hp |
| 3,200 lb | 214 hp | 289 hp | 380 hp | 488 hp | 614 hp |
| 3,600 lb | 240 hp | 326 hp | 427 hp | 549 hp | 690 hp |
| 4,000 lb | 267 hp | 362 hp | 475 hp | 610 hp | 767 hp |
| 4,400 lb | 294 hp | 398 hp | 522 hp | 671 hp | 844 hp |
| 4,800 lb | 320 hp | 434 hp | 570 hp | 732 hp | 921 hp |
🔧Weight Reduction Effect on ET (13.0s baseline)
| Weight Removed | New Race Weight | Approx ET Change | New ET |
|---|---|---|---|
| 0 lb | 3,800 lb | baseline | 13.00 s |
| 100 lb | 3,700 lb | about -0.11 s | 12.89 s |
| 200 lb | 3,600 lb | about -0.22 s | 12.78 s |
| 300 lb | 3,500 lb | about -0.34 s | 12.66 s |
| 400 lb | 3,400 lb | about -0.46 s | 12.54 s |
| 500 lb | 3,300 lb | about -0.58 s | 12.42 s |
⚙Formula Breakdown
💡Drag Racing Estimate Tips
With an eye on the finish beam and a raised heart rate you stand ready at the starting line of a quarter mile track. Once the light goes green and engine roars, the slip paper you get will contain more than just bragging rights. Inside is a hidden equation that converts raw speed into an estimate of horsepower without a trip to the chassis dyno. This trick has been used by racers for decades as it’s impossible to hide behind unforgiving physics of acceleration.
Use the tool above to input your race weight plus your elapsed time or trap speed. Then, see what your numbers really say about engine’s output. What was once a confusing slip of paper becomes a clear picture of power.
How to Calculate Horsepower from Your Drag Race Slip
Two old-school empirical formulas rule drag racing, and they’re what the math is based off. First there’s trap speed (terminal velocity at the finish line). This was developed by Roger Huntington and became widely used thanks to Geoffrey Fox. It’s expressed as follows: Horsepower equal weight times the cube of mph, divided by 234. The second factor is elapsed time. Here the horsepower equation is expressed as weight times the cube of mph, then divided by 5.825. That’s also a cubic relationship but with a different divisor.
These are curve fits based on thousands of actual runs. They presume you have good traction and driver is not babying it. They’re ballpark, not lab results, but on a sorted vehicle they come pretty darned close to the dyno results. But if those two numbers don’t agree, then believe the trap speed figure.
Trap speed is controlled largely by mass being sped up and the average power generated over the run. Relative to clean launch, it isn’t very sensitive. But elapsed time depend significantly on the first sixty feet. If you bog off the line or spin your tires, you’ll post a slow ET which leads the time-based model to guess low on the amount of power you’re putting down. You may in fact be trapping a high speed that tells us about the true health of engine.
This is why guys who bracket race look at trap speed for indication of how well the engine are working and treat ET as a combination of driving skill and power. You can’t just look at horsepower: how does it feel on the street? How does a 400 horsepower lightweight coupe compare with a 400 horsepower sedan? Acceleration is power divided by mass. That is pounds per horsepower, where lower is quicker, and horsepower per ton where higher is better. The mid-four second range is roughly 10 pounds per hp, which seems like a strong muscle car. Get down to 6 pounds per hp and you’re into supercar territory.
This ratio helps you visualize what happens when you add power versus stripping weight. There comes a point where power doesn’t matter as much; dropping pounds makes a bigger difference. It also does the modeling backwards, which is really nice if you’re trying to plan. You put in amount of power you want and it tells you what trap speed and ET you should of expect with that horsepower out of your particular car. Want a build that will go an eleven-second quarter? See exactly how much horsepower your particular weight require.
Want to shop and have a vendor tell you they’ll make X-amount of power? See if their reported trap speeds matches the speeds others have run to prove that claim. It takes it away from “vague promises” and puts it into something you can measure.
Mass is huge because both formulae scale directly with weight. A popular rule of thumb is that for every 100 pounds you reduce from your typical street car, you gain about one mph of trap speed and a tenth of a second in the quarter. Quietly there’s a couple hundred pounds to be found stripping out heavy subwoofer or a rear seat or even that spare tire. Weigh the car the way you run it (with driver aboard and realistic fuel load), don’t guess light, as that will inflate all your horsepower estimates.
Once you plug those numbers into the calculator, it do the math for you, no need to convert coefficients by hand. The default value of 234 for the divisor in the trap model is what you might call a classic fit for a well-driven car on decent tires. Hard launching cars on slicks or drag radials may be approximated by a constant that’s a little lower. You can choose different constants via the interface and observe how much the estimate changes based on driveline loss and launch quality.
It’s a nice reminder that there’s a margin of error to the numbers because they are subject to gearing, tire diameter, aerodynamic drag and density altitude. Testing the results on a cool, prepped track surface will give you a very different pattern than on a hot afternoon at high elevation. The presets will fill in speed and weight fields so that you can see what various cars translate into horsepower. The light Miata, Hellcat or Mustang GT presets work well as bases from which to tweak one factor at a time.
Keep in mind that all of them are smart approximations; not gospel truths. They are great for a starting point, a sanity check on what someone claimed on a dyno, or even a ballpark goal for your next build. As long as there is smoke, noise, and numbers to go by, these remain the tools drag racers has used for generations to turn those things into data you can use.
When you see another time slip, take it with a grain of salt; they are merely clues. It’s all about the time, the speed and the weight. If you can read the finish line, you don’t have to be on a dyno to know what your car is capable of doing.