Income Needed to Buy a Home Calculator
Work backward from a target house price to the annual salary you need to qualify. This tool builds the full monthly PITI payment - principal, interest, property tax, insurance, PMI and HOA - then applies the classic 28/36 debt-to-income rule to report the required income, taking the more conservative of the front-end and back-end limits.
🎯Real Affordability Scenarios
📝Home & Loan Details
Purchase price of the home you are targeting.
Percent paid up front. Under 20% adds PMI.
Annual interest rate on the loan.
Length of the mortgage, usually 15 or 30.
Annual tax as a percent of home price.
Annual homeowners insurance premium.
Condo or association dues, per month.
Car, student loans and card minimums.
Applied to the loan when down is under 20%.
Housing payment share of income. Default 28.
All debts share of income. Default 36.
🔢Rule Snapshot
📊Home Price to Required Income
| Home Price | Loan (20% Down) | Monthly PITI | Required Income |
|---|---|---|---|
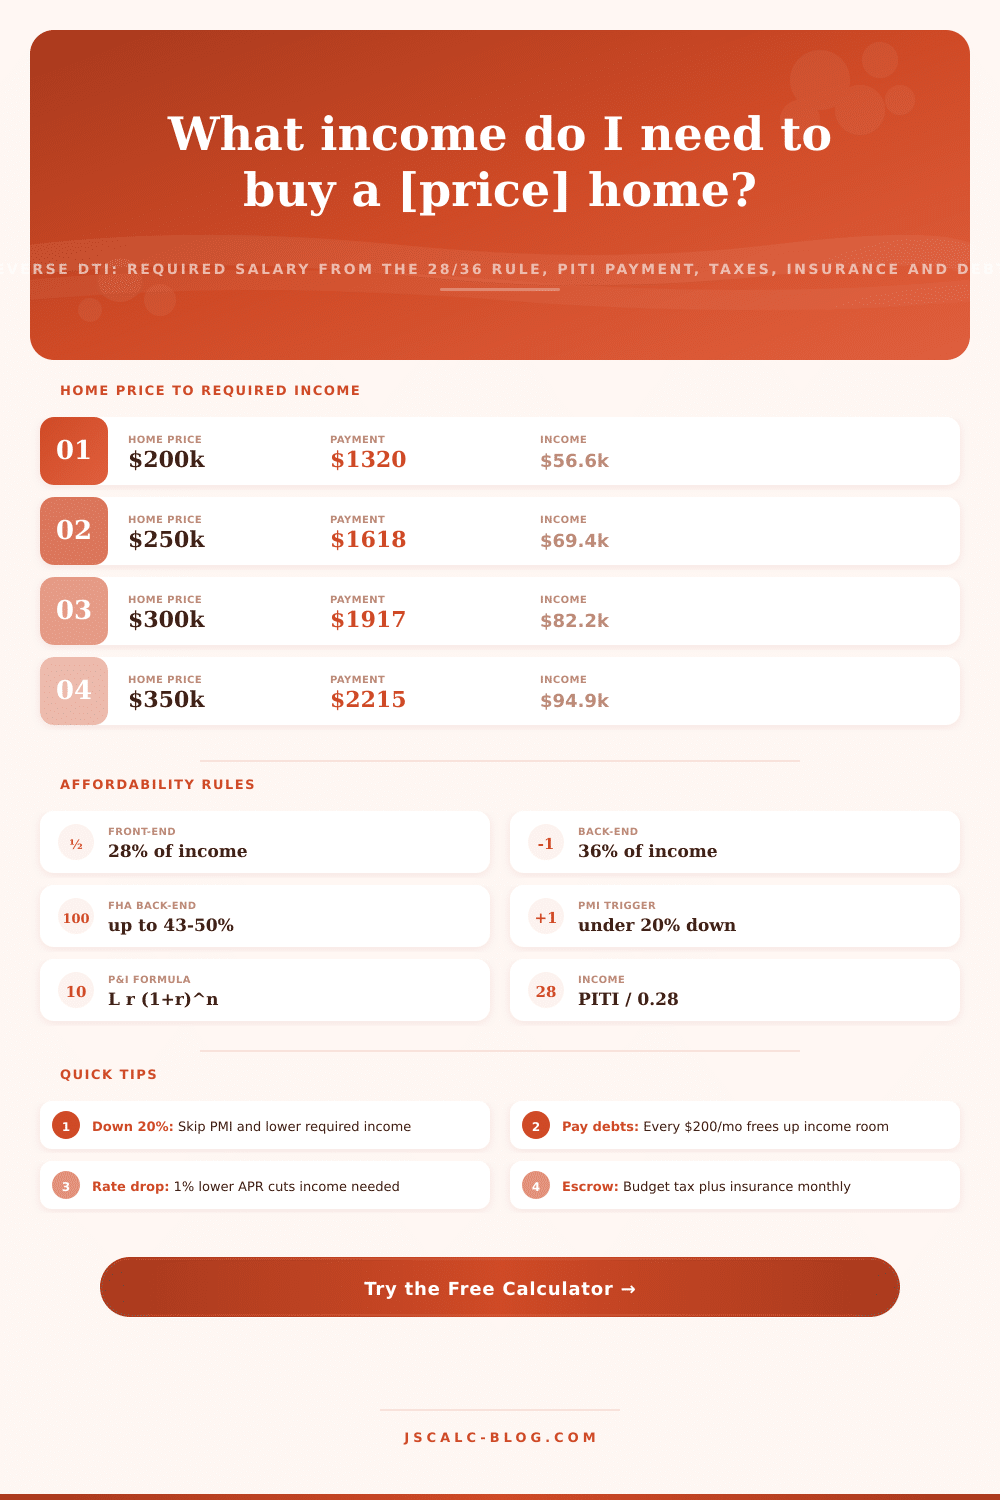
| $200,000 | $160,000 | $1,320 | $56,600 |
| $250,000 | $200,000 | $1,618 | $69,400 |
| $300,000 | $240,000 | $1,917 | $82,200 |
| $350,000 | $280,000 | $2,215 | $94,900 |
| $400,000 | $320,000 | $2,514 | $107,800 |
| $500,000 | $400,000 | $3,112 | $133,400 |
| $650,000 | $520,000 | $4,008 | $171,800 |
| $800,000 | $640,000 | $4,904 | $210,200 |
| $1,000,000 | $800,000 | $6,098 | $261,400 |
Assumes 6.5% APR, 30-year term, 1.1% property tax, $1,500 annual insurance and the 28% front-end rule with no other debts.
📋DTI Ratio Guidelines by Loan Type
| Loan Type | Front-End | Back-End | Min Down | Notes |
|---|---|---|---|---|
| Conventional | 28% | 36% | 3% - 5% | PMI under 20% down |
| Conventional (strong) | 28% | 45% | 5% | High credit and reserves |
| FHA | 31% | 43% - 50% | 3.5% | MIP for the loan life |
| VA | - | 41% | 0% | Residual income test |
| USDA | 29% | 41% | 0% | Rural, income limits |
| Jumbo | 28% | 36% - 43% | 10% - 20% | Tighter reserves |
💵How Debts Raise the Income You Need
| Monthly Debt | Front-End Income | Back-End Income | Governing Rule |
|---|---|---|---|
| $0 | $107,800 | $84,600 | Front-end |
| $250 | $107,800 | $92,900 | Front-end |
| $500 | $107,800 | $101,300 | Front-end |
| $750 | $107,800 | $109,600 | Back-end |
| $1,000 | $107,800 | $118,000 | Back-end |
| $1,500 | $107,800 | $134,600 | Back-end |
Based on a $400k home, 20% down, $2,514 PITI. Once debts pass about $700/mo the back-end rule takes over and drives the required income.
🗃Price vs Required Income Comparison Grid
| Home Price | 20% Down | Monthly PITI | Income @ 28% | Income @ 36% | Hourly (40h/wk) |
|---|---|---|---|---|---|
| $200,000 | $40,000 | $1,320 | $56,556 | $43,988 | $27.19 |
| $250,000 | $50,000 | $1,618 | $69,356 | $53,943 | $33.34 |
| $300,000 | $60,000 | $1,917 | $82,156 | $63,899 | $39.50 |
| $400,000 | $80,000 | $2,514 | $107,755 | $83,809 | $51.81 |
| $500,000 | $100,000 | $3,112 | $133,355 | $103,720 | $64.11 |
| $650,000 | $130,000 | $4,008 | $171,754 | $133,586 | $82.57 |
| $800,000 | $160,000 | $4,904 | $210,153 | $163,452 | $101.03 |
| $1,000,000 | $200,000 | $6,098 | $261,352 | $203,274 | $125.65 |
Income at 28% uses the front-end rule; income at 36% assumes no other debt. Hourly rate divides the 28% income by 2,080 work hours a year.
⚙Formula Breakdown
💡Smart Affordability Tips
Home buyers begin by asking the wrong question: “What’s this house worth?” They should of asking: “How much do I have to earn so a lender can say yes?” This page’s calculator reverses that equation. Enter your desired purchase price and it determines how much you’d need to earn annualy to get approved for financing. Then it puts together entire housing payment (including mortgage) and runs it through the debt-to-income rules underwriters apply daily.
There’s the sticker price for the house; there’s the bar for mortgage approval set by your level of debt compared to your income. When lenders say “can you afford it?”, they don’t mean “do you have enough money to make the payment.” They’re looking at two ratios. The first (the front-end) is how much of your gross monthly income are used by the housing payment alone. The other (back-end) is how much of your gross monthly income is used by your total monthly debt payments. If your ratios is higher than those limits, the loan gets denied or resized.
How Much Income Do You Need?
The answer focuses on those two ratio. The system first gathers all real expenses associated with ownership, what’s called the PITI (principal, interest, taxes and insurance). It does this by plugging in old amortization formula for principal and interest. Then it uses your downpayment to calculate the loan amount (price less down). It adds monthly property tax (home price x annual tax rate divided by 12). And then it adds one twelfth of the annual insurance premium.
Most estimates stop here. They consider just the note without the taxes and insurance sitting atop it. Those unseen expenses increase the required income beyond what a simple payment calculator might indicate. There’s one other cost, two, actually, that sneakily increase the earnings necessary to qualify. When you put less than 20% down on a house, the lender demands “private mortgage insurance,” known as PMI. Our calculator assumes it’s a fraction of the loan amount spread over a year. Save toward a bigger down payment and you’ll clear the 20% hurdle where PMI vanishes completely.
Next, homeowners association dues gets tacked onto the month-to-month bill. They both add to the monthly total, which bumps up housing payment and thus increases the salary you must earn to fit within the front-end constraint. In many cases, watching those two lines is the fastest way to change your result.
And there’s the payment we know. Now, here comes the magic: We’re going to use the old-school 28/36 rule on this thing. According to the front-end test, no more than 28% of your gross monthly income can go toward housing payments. By the back-end test, no more than 36% of your gross monthly income goes to housing AND all other debts combined. The calculator figures these out for you and tells you higher number, i.e., the more conservative number. Lenders are going to make you follow it. It is a strict rule. Yes. But it’s easy to understand.
Two similar buyers may require vastly different salaries because of other monthly payments. Those monthly debts aren’t reflected in the front-end ratio; only in back-end ratio. If you have minimal other debts, such as student loans, a car loan, or a minimum credit card payment, then the front-end rule typically dictates the required salary. In this case, the house alone determines your salary goal. But if you already owe hundreds of dollars per month, the back-end rule kicks in and you’ll need to earn more just to live in the same house.
Here’s the income you would need to earn: It has presets for your typical scenarios, from a modest starter condo to a luxurius purchase carrying significant debt. A single click fills out the form and makes calculations on the fly. It also comes with a table of references where you can see how much income you need based off home price. There’s a generous spreadsheet comparing every price to income at both the 28 and 36 percent levels. Another set lists debt-to-income guidelines for all types of loans. It even converts that number to the equivalent of an hourly wage.
Take the outcome as a solid estimate. Not a promise. Rates fluctuate and loan programs matter. Your credit score, cash reserves, and job history also factor into real-time approval, so they are worth weighing too. But at least you know how much income a certain home requires. That’s an awesome way to plan. Do you need to get out of debt before buying? Should you save more for a downpayment? Is this the right time to move up in your price range? Or should you shoot lower?
Enter a few different price points and adjust the variables. You’ll enter any meeting with your mortgage lender already armed with the salary math behind your dream house. You started with a price tag. Now you’ve got the full story on the cost of ownership.