Home Equity Calculator
See a clear snapshot of the equity in your home right now, in both dollars and percent, along with your loan-to-value ratio and exactly how much of that equity you could borrow at the common 80%, 85%, and 90% combined loan-to-value caps lenders use for HELOCs and home equity loans.
🏡Real Homeowner Presets
📝Your Home and Loan Details
Today's market value from an appraisal or online estimate.
Remaining principal owed on your primary mortgage.
Any existing HELOC or home equity loan balance.
Max combined loan-to-value the lender allows.
What you paid; used to split equity sources.
Cash you put down when you bought the home.
Projected yearly value growth for the outlook.
Controls how dollar amounts are rounded.
🔢Equity Formula Snapshot
📊Borrowable Equity by CLTV Cap
| CLTV Cap | Max Combined Loan | Less Current Balance | Borrowable Cash |
|---|---|---|---|
| 80% | $0 | $0 | $0 |
| 85% | $0 | $0 | $0 |
| 90% | $0 | $0 | $0 |
| 95% | $0 | $0 | $0 |
💰Where Your Equity Came From
| Source of Equity | Amount | Share of Total | How It Built |
|---|---|---|---|
| Original down payment | $0 | 0% | Cash at purchase |
| Principal paid down | $0 | 0% | Payments over time |
| Market appreciation | $0 | 0% | Value rising |
| Total current equity | $0 | 100% | All sources combined |
📈Equity Outlook If Value Appreciates
| Years Ahead | Projected Value | Balance (Level) | Projected Equity | Equity % |
|---|---|---|---|---|
| Today | $0 | $0 | $0 | 0% |
🗄Equity and Borrowable Cash Comparison Grid
| Home Value | Total Owed | Equity $ | Equity % | Tap @ 80% | Tap @ 85% | Tap @ 90% |
|---|---|---|---|---|---|---|
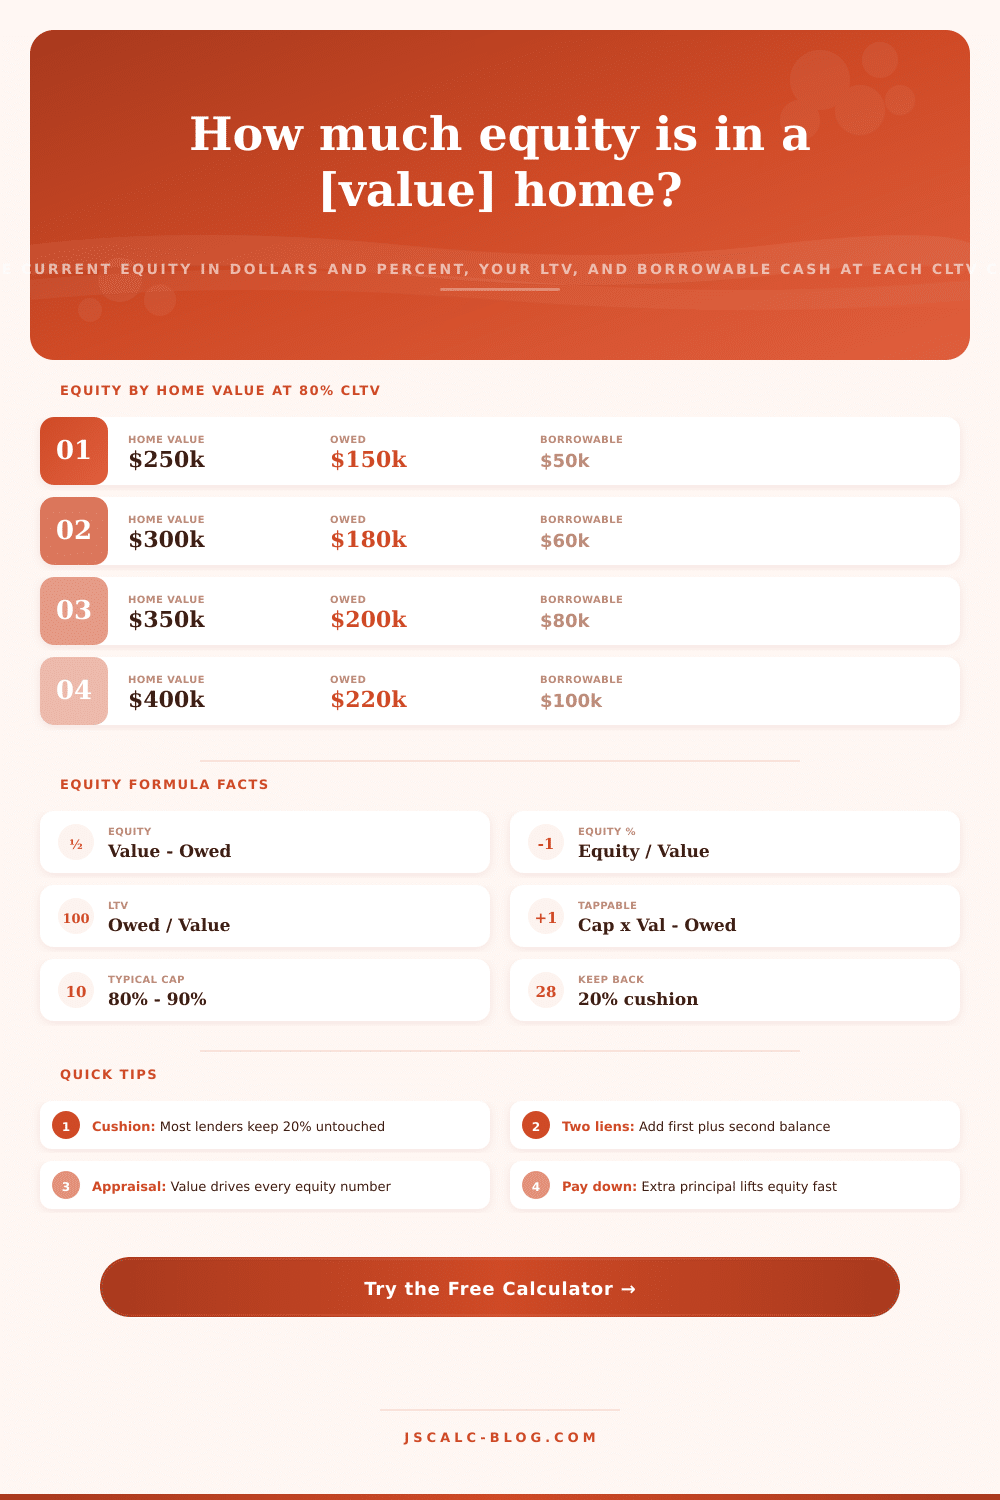
| $250,000 | $150,000 | $100,000 | 40.0% | $50,000 | $62,500 | $75,000 |
| $300,000 | $180,000 | $120,000 | 40.0% | $60,000 | $75,000 | $90,000 |
| $350,000 | $200,000 | $150,000 | 42.9% | $80,000 | $97,500 | $115,000 |
| $400,000 | $220,000 | $180,000 | 45.0% | $100,000 | $120,000 | $140,000 |
| $450,000 | $250,000 | $200,000 | 44.4% | $110,000 | $132,500 | $155,000 |
| $500,000 | $280,000 | $220,000 | 44.0% | $120,000 | $145,000 | $170,000 |
| $600,000 | $330,000 | $270,000 | 45.0% | $150,000 | $180,000 | $210,000 |
| $750,000 | $400,000 | $350,000 | 46.7% | $200,000 | $237,500 | $275,000 |
| $900,000 | $500,000 | $400,000 | 44.4% | $220,000 | $265,000 | $310,000 |
| $1,000,000 | $550,000 | $450,000 | 45.0% | $250,000 | $300,000 | $350,000 |
⚙Formula Breakdown
💡Home Equity Tips
A house become an investment. It’s a financial tool. You can sell it for cash. Or you can hang onto it for wealth.
But here’s where it gets tricky: many of us don’t realy understand our exact level of equity. Homeowners know they’re worth something, but most won’t be able to tell you exactly how much … until they log into their bank account. This lack of knowledge cause anxiety. Tuition payments are due. A roof needs replacing. What do you do?
How Much Equity Is in Your Home?
This page clear away all guesswork. It shows you in plain terms what you own, and what you could borrow against.
In theory, equity is straightforward mathematics. Your home’s present value minus its loans equal your equity. For example, you purchase a home for $300K. Today, you still owe $250K. You now hold $50K in equity. However, this figure tell only half the story.
What lenders realy want to know isn’t just your equity, but also how risky they are to lend money. Enter the combined loan-to-value ratio. This protect both parties. You avoid taking on too much debt so you aren’t underwater when prices drop slightly. The lender avoid losing money.
There’s also the confusion between total equity and how much of that equity can be borrowed. For example, let’s say you’ve got one hundred thousand dollars in equity. But your lender won’t allow more than eighty percent of the house to be borrow against. Then you can’t borrow every last penny. The math dictate a buffer zone. Let’s say you owe two hundred and fifty thousand on a half million dollar house. If your lender has an eighty percent cap, then they will only allow up to four hundred thousand in total debt on the property. Because you already owe two hundred and fifty thousand, you’re down to one hundred and fifty thousand in available new borrowing power. That’s the safety margin. It’s not money you can readily spend, but it’s money that you theoreticly do own.
And you need it. Without that safety margin, when market turns south, it’s hard to refinance; when it’s time to sell, it’s tougher still.
There’s a second dose of reality: Lenders don’t consider your online estimate; they consider the appraisal. Your house could be valued at six hundred thousand by an automated value model. But the appraiser can only find comparables that is worth five hundred fifty thousand. Suddenly, your borrowing power diminishes.
Try plugging in various values into tool on this page. Experiment. Understand just how sensitive your equity is to market swings. That tool also explains your equity. Where it came from. How much did you get via appreciation (a gift from the wider market)? How much did you get via discipline (the principal you’ve paid off)? How much did you get by writing a check (your original downpayement)?
Principal paydown lasts forever. Appreciation is fleeting. Understanding the source of your wealth will change how you defend it. And when you look at the projection tables, do not forget that it’s assuming a static balance… And that value increase! The reality is that your balance also decreases each month, so in fact, your true equity appreciation exceed this conservative estimate.
Play around with presets to run some what-if scenarios (for example, tapping into a luxurios home / second lien). But never lose sight of that CLTV cap. That’s the governor on the engine. When you understand it, your home becomes less of a vague asset; and more of a predictable money source. This means you can make plans confidentally, instead of hoping.