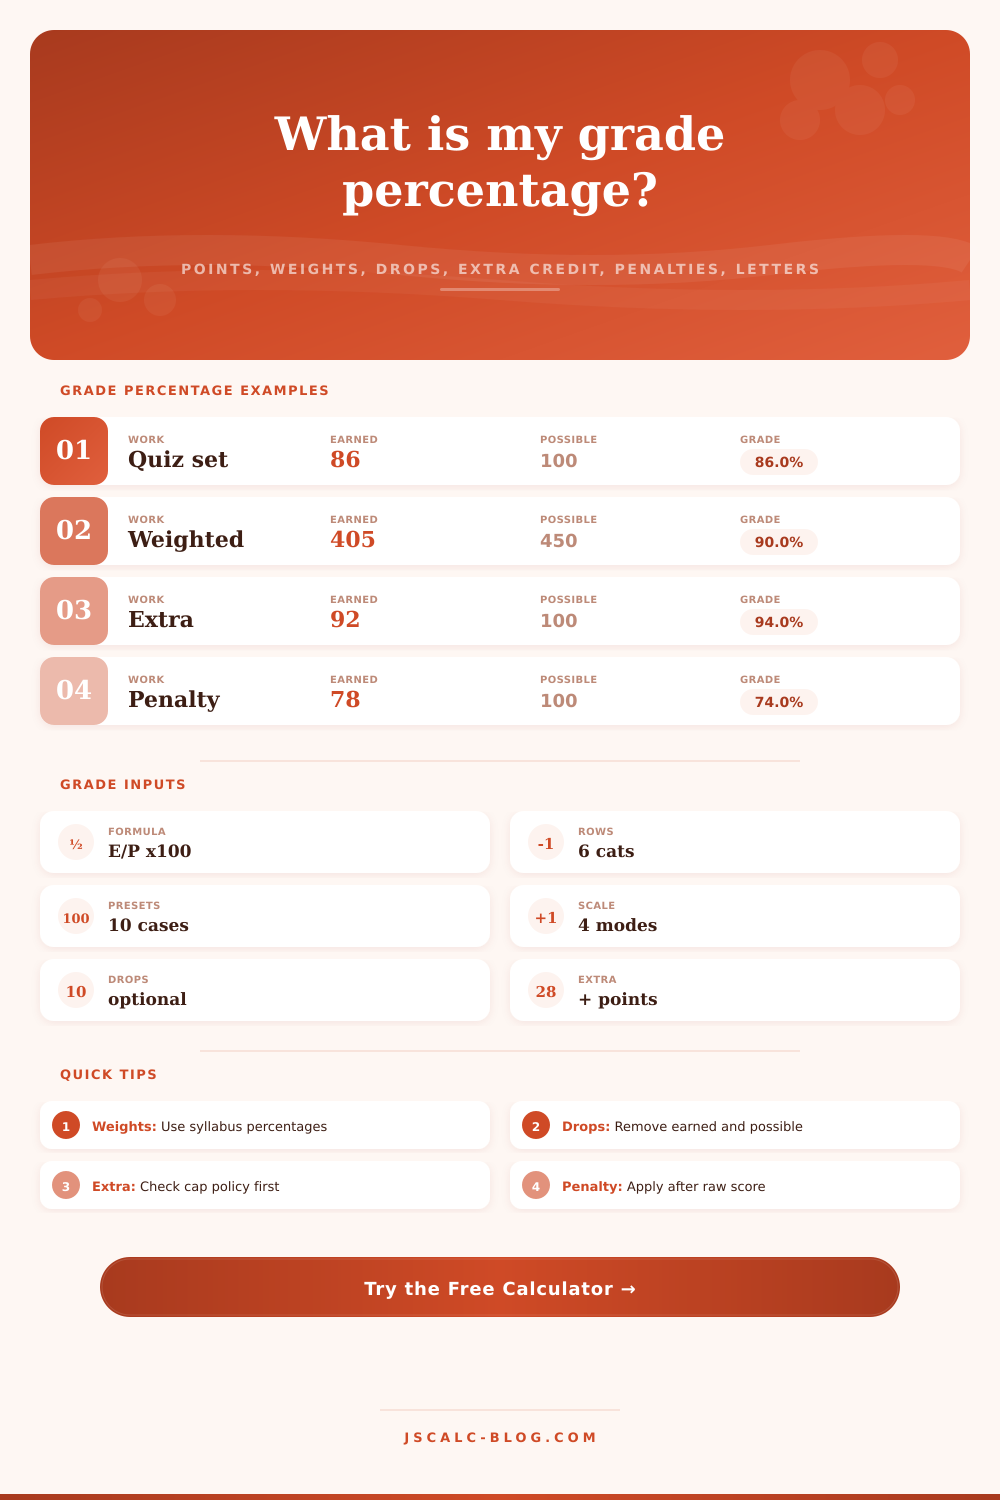
Grade Percentage Calculator
Calculate an overall course percentage from earned and possible points, weighted categories, extra credit, penalties, dropped items, and a selected letter grade scale.
Enter category scores and calculate.
| Use | Category | Weight % | Earned | Possible | Extra | Penalty % | Drop earned | Drop possible |
|---|---|---|---|---|---|---|---|---|
| Category | Adjusted earned | Adjusted possible | Raw percent | Weight used | Weighted points | Status |
|---|
| Scale | A range | B range | C range | D / pass | Best fit |
|---|---|---|---|---|---|
| Standard | 90-100 | 80-89.9 | 70-79.9 | 60-69.9 | Common percentage courses |
| Plus/minus | A- starts 90, A starts 93 | B- starts 80, B starts 83 | C- starts 70, C starts 73 | D- starts 60 | Transcript-style detail |
| Strict | 93-100 | 85-92.9 | 77-84.9 | 70-76.9 | Harder high school scale |
| College pass | 90-100 | 80-89.9 | 70-79.9 | No D band | Programs where C is passing |
| Custom | Input A cutoff | Input B cutoff | Input C cutoff | Input D cutoff | Syllabus-specific policies |
| Target | Current grade | Point gap | Extra raw points needed | Penalty cushion | Status |
|---|
| Method | Formula | Uses weights? | Handles drops? | Note |
|---|---|---|---|---|
| Raw points | earned / possible x 100 | No | Yes | Best when every point has equal value. |
| Weighted category | sum(category % x weight) / sum(weights) | Yes | Yes | Matches most syllabi with category percentages. |
| Extra as points | (earned + extra) / possible x 100 | Optional | Yes | Extra credit increases the numerator. |
| Extra as percent | weighted grade + extra percentage points | Yes | Yes | Use for syllabus bonus points on final average. |
| Penalty | adjusted percent x (1 - penalty rate) | Yes | Yes | Applied after point adjustments in each category. |
The midterm was worth 20% of your grade and you didn’t do as well than hoped. Panic ensues! Immediately you check email for the syllabus.
Most students regard their grades as a black box; they hope that some good behavior will cancel out a poor test score. They’re not sure how the grade work. It is mostly a weighted percentage. They cannot understand this, and if you cannot manage it, you cannot improve it. Once you plug your grades into the calculator (above), it does the messy math for you. No more fiddling with bonuses and drops.
How to Calculate Your Grade
To start, let’s distinguish between weighted categories and raw points. If your class is strictly point-based (meaning all assignments is worth the same number of points towards the overall total), then this won’t work. Most college classes follow a system of weighted categories, which means certain assignment may hold more weight than others. For instance, a weekly quiz could be worth less than a final exam. The tool will adjust these weights by asking you how many possible/earned points you got in each category. It will calculate your percentage based off the category, then apply the weight.
The big takeaway here: even if you do really well on one part with a light weight, it won’t save you from bombing the final which carries much more weight. Focus on what matters.
In most cases, the math is obscured by legalese on syllabi. Penalties and extra credit create confusion. Will extra credit cap at 100 percent? Will it increase your average? Is professor going to add points to numerator or directly to the final average? The second option is adding percentage points directly to your final average; the first is two totally different operations. It sounds like a minor distinction, but across a semester that’s what makes the difference between a B plus and an A minus. Before you assume anything about how those bonus points will behave, look up the policy for your class. This calculator will let you switch back and forth between these modes, so you can see whether one is better than the other for you.
Another area of confusion is dropped assignments. In many classes, they let you drop your lowest quiz grade. People will take off only what they earn on the test. This means those lost points still count against you, effectively punishing you twice. They need to be taken away in both places. Say you drop a twenty point quiz. They are gone from numerator and gone from denominator. Twenty points dissapears from the top and bottom of the fraction. Simple fix, but something you have to do consciously.
The letter grades themselves is nothing more than arbitrary buckets we’ve collectively decided to use. Many institutions grade on a plus or minus scale, and others have a cut-off that’s stricter than normal, e.g., 93 as the beginning of an A rather than 90. It’s critical to understand which scale applies to your class so you know what goals is realistic. For example, if your school has a strict 93 cut off while you’re trying for a 90, then maybe you’re actualy aiming for the wrong thing altogether. The page’s reference table outlines these differences. Match up your expectations against the actual grading policy.
It’s not about calculating your grade with an obsession over each decimal place. It’s about taking command of a process that has been made unclear. Breaking it all down into weighted parts transforms your anxiety into data: you quantify the rules by which they operate. You get an exact sense of where you are, and how far you need to go to achieve your goal. The understanding should of been better than the grade.