Future Value Home Calculator
Project what your house will be worth after years of appreciation. See the nominal future value, the inflation-adjusted (real) value in today's dollars, the total appreciation gained, and your future equity once the remaining mortgage is paid down.
🎯Real-World Scenarios
📝Home & Growth Inputs
Long-run US average sits near 3% to 5% per year.
Money added to value each year (renovations, additions).
Used to discount the future value into today's dollars.
Whether added improvement dollars also appreciate.
Set to 0 if the home is owned free and clear.
Remaining term today. Balance is amortized forward.
🔢Projection Snapshot
📈Value & Equity By Year
| Year | Home Value | Real Value | Appreciation | Loan Balance | Equity |
|---|---|---|---|---|---|
| Enter values above to see the year-by-year projection. | |||||
📊Appreciation Rate Scenarios
| Rate | 10yr Factor | Value in 10yr | Value in 20yr | Doubling Time | Market Type |
|---|---|---|---|---|---|
| Rate scenarios from 2% to 7% appear after calculation. | |||||
💰Nominal vs Inflation-Adjusted Grid
| Years | 2% | 3% | 4% | 5% | 6% |
|---|---|---|---|---|---|
| The nominal value grid appears after calculation. | |||||
Each cell is the projected nominal home value at that appreciation rate and horizon, based on your current value. Compare against the real value cards above to see how inflation erodes buying power.
📜Historical US Home Appreciation
| Period / Market | Typical Annual Rate | What It Means |
|---|---|---|
| Very long-run US average | ~3% to 4% | Roughly tracks or slightly beats inflation over decades. |
| Strong national years | ~5% to 7% | Broad demand, low supply, easy credit push prices up. |
| Hot local metros | 8%+ | Sun Belt and tech hubs in boom cycles; not sustainable forever. |
| Flat / cooling markets | 0% to 2% | Prices barely keep pace with inflation; real value can slip. |
| Downturn years | Negative | 2008-style corrections can erase several years of gains. |
| Rule-of-72 quick check | 72 / rate | At 4% a home value doubles in about 18 years. |
Figures are illustrative long-run ranges, not a forecast. Local supply, demand, and rates dominate any single home's path. Verify current data before major decisions. Source overview: JSCalc-Blog.com.
⚙Formula Breakdown
FV = PV × (1 + r)^n where PV is today's value, r is the annual appreciation rate as a decimal, and n is the number of years. Each year grows on the previous year's balance, so gains compound.realFV = FV / (1 + i)^n where i is the inflation rate. This restates the future price in today's purchasing power so you can compare it honestly to the current value.appreciation = FV – PV. The raw dollar gain in future dollars. The real gain uses the inflation-adjusted value instead, which is always smaller when inflation is positive.M = P×c(1+c)^N / ((1+c)^N – 1), with c the monthly rate and N the remaining months. Any months beyond the term leave a $0 balance.equity = FV – projected loan balance. As the home appreciates and the loan amortizes, equity grows from both ends at once. A paid-off loan makes future equity equal to the full future value.💡Smart Projection Tips
Educational estimate only, not financial or investment advice. Real estate returns are never guaranteed. Built by JSCalc-Blog.com.
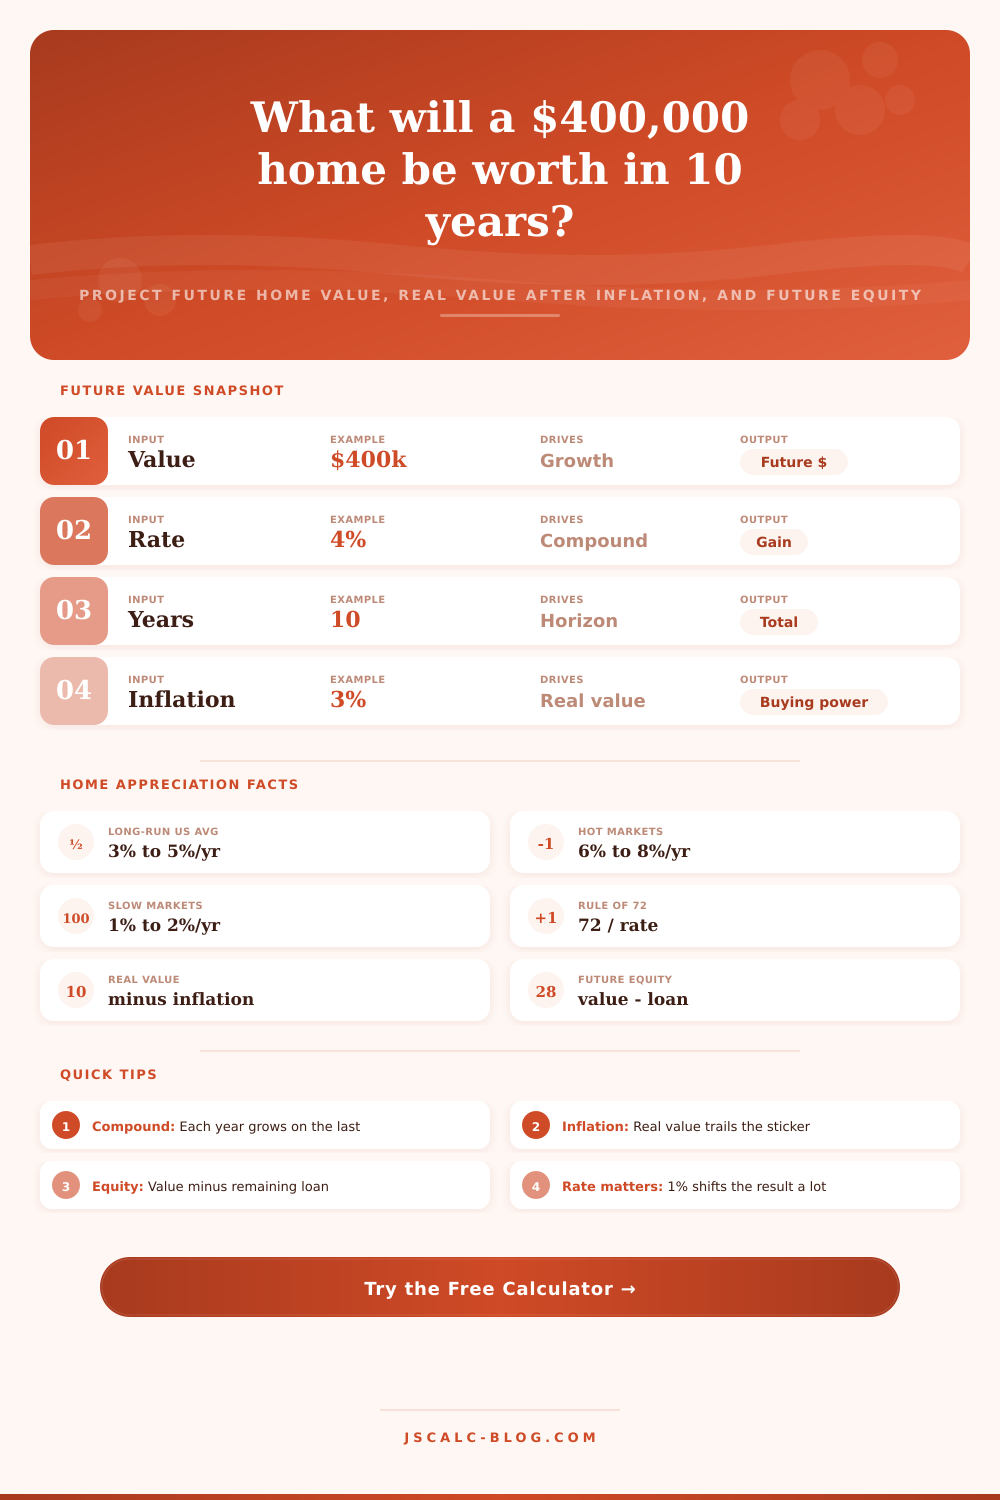
To help with this, I created future value home calculator on JSCalc-Blog.com. Simply input current price of a home, the percentage it’ll appreciate each year (e.g., 4% annually), and how many years you want to project into the future. It calculates both your future equity (the value minus any remaining loan balance) as well as total appreciation you’ve made. It also calculates the inflation-adjusted value (measured in today’s dollars) and nominal future value.
It turns fuzzy real-estate dreams into concrete reality. Most people buy homes with an emotional story about family or comfort, but they hold them for financial reasons. But you can’t understand either reason until you look beyond the purchase price.
A New Tool to Check Your Home’s Future Value
At its heart, the calculator implement the familiar compounding growth formula: FV = PV * (1 + r) ^ n Because the exponent drives appreciation, this is where magic happens. Each year, your home receive a percentage of a bigger and bigger base. The longer you own a house, the more its value tends to increase over time.
Ten years of 4% growth in a $400,000 home isn’t just $400,000 + 10 years x 4% (which would be $480K). It compounds into something like $592,000. Why? Because each year’s growth is based on last year’s larger figure.
Don’t assume that one rosy estimate is good enough. Small changes in rates; say, by just 1 percentage point, will cause far-year figures to jump wildly.
This is the Real Value Formula. Because a dollar in the future isn’t worth as much as a dollar now, it’s tricky to interpret “future” prices. To deal with this, the calculator include what I call the real value formula: the future value divided by (1 + inflation)^years. It turns the predicted price into today’s purchasing power.
With inflation at 3% and home appreciation at 5%, your sticker price soars, but you’re only really gaining around 2% per year after adjusting for inflation. That’s a huge difference, and these two views are designed to highlight it: your real gain summary and your inflation-adjusted value. They’re the most honest part of this calculator because they force you to compare both real and nominal numbers.
If most people see their house go up in price on paper (without understanding that a portion of that rise is just money devaluing), they think they’re rich… But if the home outpace inflation, it’s building your wealth. If it matches inflation, it’s keeping pace with your wealth. How do you know? It changes how you plan.
But it’s only part of the equity story: Your actual net worth in the house is not just its future value (it also depend on how much debt remains). Enter your current balance and interest rate, along with number of years remaining on the loan, and the optional mortgage inputs will calculate a future payoff schedule of the loan based on the classic payment equation. Based on this, it determine what the loan balance will be in your target year, then reports the future equity (future value minus projected loan balance).
That’s where this calculation gets really helpful for decision-making. Because the loan reduces over time AND because the home itself appreciates, there are actualy two positive forces working to increase equity simultaneously. In fact, a homeowner ten years into a 30-year mortgage often finds that the mix of home value increases and loan payments creates much more equity than either would alone.
Future equity will simply be equal to the total future value if the loan should of been paid off by target year.
It distinguishes between two things that folks tend to conflate: One time additions (a.k.a. These are renovations and the way your whole house’s value grows every year through market appreciation. The optional “annual improvements” line allows you to add back in dollars spent on renovations. You can also decide if these improvements appreciate at market rates, or remain as flat dollar increases. Keeping them separate prevents you from treating a kitchen remodel as an investment engine.
Kitchen Remodels aren’t a growth engine, but Appreciation is. Most folks miss this bit. They assume that any dollars spent on the house will be returned in proportion to the dollars spent. But the house doesn’t care who spent the dough. The market determines what it’s worth, not the contractor.
Below the result cards is a table tracing home value, real value, appreciation, equity, and loan balance year by year with typical horizons. This table highlights your target year. Below it is an appreciation-rate scenario table showing how different growth assumptions (ranging from 2% to 7%) will reshape the outcome. Doubling times are shown using the Rule of 72, which lets you double-check any rate. There’s also a nominal versus real grid laying out projected values in a quick-to-read format for seven horizons and five rates. Finally there’s a historical reference table framing what actual long-run US appreciation has looked like.
Don’t bet on one scenario, do a high, medium, and low scenario instead. Housing operates in long cycles: boom, plateau, then correction. What seems normal near the peak of a boom could prove much more higher over the coming decade.
This is for anyone curious about their home value in 15 years. It is also for those considering downsizing during retirement, thinking about making a move, or wanting to see if they should hold on for another year or two. The calculator provides you with a quick, clear-cut view of where you could end up, based on actual formulas.
Keep in mind, there are no guarantees that housing will appreciate, and that it does go through cyclical patterns. So take each estimation for what it is: an estimation for planning, NOT a guarantee of anything. This is the main point of the exercise.
This isn’t a question of “What is my house worth?” This is a question of “How much wealth do I retain at the end of all this?”
Visit JSCalc-Blog.com for more free real estate and financial calculators.